Bands Structure with Density of States
Similar to the bands structure plot PyProcar goes beyond the conventional plain Density of states(DOS) plot to plot the projected DOS that carry more information. DOS plots in PyProcar have multiple functionalities(modes), plain, parametric, parametric_line, stack, stack_orbitals and stack_species. To read the information about DOS from the output of DFT calculations pyprocars depends on different files depending on the DFT package. In VASP PyProcar uses vasprun.xml while in elk it uses specific files generated by elk, given the elk.in PyProcar will resolve the files that need to be parsed. The Parameters used in this function are very similar to the ones in bandsplot.
We first explain the arguments involved in this function, then we explain the different mode using examples. Each argumnet will have a description, an example and a the dafault setting. If the desired setting matches the default, one does not need to specify that aregumnet.
Parameters
- param bands_file
path to the PROCAR file associated with the bands plot. It can be in different directories or the same directory
examples:
bands_file='PROCAR',bands_file='../PROCAR',bands_file='bands/PROCAR'default:
bands_file='PROCAR'- param dos_file
The most important argument needed dosplot is
vasprunfile.vasprunfiledefines the path to vasprun.xml from the density of states calculation. If plotting is being carried out in the directory of the calculation, one does not need to specify this argument.example:
dos_file='vasprun.xml'default:
dos_file='vasprun.xml'- param outcar
The OUTCAR of bands calculation. This file is only needed to read the fermi energy. One can provide the *OUTCAR from Density of States calculation for more acurate calculation.
example:
outcar='OUTCAR'default:
outcar='OUTCAR'- param abinit_output
Not implemented yet.
- param bands_mode
defines the mode of bands plot. This plot can be plain of color coded base on the projection parameters provided. For more information refer to the
modein bands plot section of pyprocar.examples:
bands_mode='plain',bands_mode='parameteric'default:
bands_mode='plain'
dos_mode
:param dos_mode: dos_mode defines the mode of Density of States plot. For more details one can refer to mode in DOS plots of pyprocar.
examples:
dos_mode='plain',dos_mode='parametric',dos_mode='parametric_line',dos_mode='stack',dos_mode='stack_orbitals',dos_mode='stack_species'.default:
dos_mode='plain'
- param plot_total
If the total density of states is plotted as well as other options. The entry should be python boolian.
examples:
plot_total=True,plot_total=Falsedefault:
plot_total=True- param fermi
Value of the fermi energy. Usually Fermi is read from path provided in
outcar. Iffermiis defined, the value of fermi is going to be over written for bands plot.examples:
fermi=-4.57default:
fermi=None- param mask
If provided, it masks bands with projection values lower than
mask. Useful to remove unwanted bands from the band structure. For instance, in bands with very low contributions, there can still be visible bands. Using a mask with a low value can get rid of these.- param markersize
Size of the marker used for plotting.
- param marker
The shape of the marker used for plotting. E.g.- ‘o’=circle, ‘s’=square, ‘-‘=line.
- param atoms
atomsdefine the projection of the atoms if any plot that is going to plotted inparametricmode. In other words it selects only the contribution of the atoms provided. This variable is only relavent forbands_mode='parametric',dos_mode='parametric',dos_mode='parametric_line'ordos_mode='stack_orbitals'. Atoms has to be a python list(or numpy array) containing the atom indices. Atom indices has to be order of the input files of DFT package. For more information on the influence ofatomson the DOS plot please refer to theatomssection of Density of States plot. For more information on the influence ofatomson the bands plot please refer to theatomssection of Bands.examples: for SrVO3 we are choosing only the oxygen atoms.
atoms=[2,3,4], keep in mind that python counting starts from zero, for a POSCAR similar to following:Sr1 V1 O3 1.0 3.900891 0.000000 0.000000 0.000000 3.900891 0.000000 0.000000 0.000000 3.900891 Sr V O 1 1 3 direct 0.500000 0.500000 0.500000 Sr atom 0 0.000000 0.000000 0.000000 V atom 1 0.000000 0.500000 0.000000 O atom 2 0.000000 0.000000 0.500000 O atom 3 0.500000 0.000000 0.000000 O atom 4
default: The default is set to select all the atoms.
- param orbitals
orbitalsdefine the projection of orbitals in any plot that going to be plotted inparametricmode. In other words it selects only the contribution of the orbitals provided. Orbitals has to be a python list(or numpy array) containing the Orbital indices. Orbitals indices has to be order of the input files of DFT package. This variable is only relavent forbands_mode='parametric',dos_mode='parametric',dos_mode='parametric_line'ordos_mode='stack_species'.The following table represents the indecies for different orbitals in VASP. For more information on the influence oforbitalson the DOS plot please refer to theorbitalssection of Density of States plot. For more information on the influence oforbitalson the bands plot please refer to theorbitalssection of Bands.s
py
pz
px
dxy
dyz
dz2
dxz
x2-y2
0
1
2
3
4
5
6
7
8
examples:
orbitals=[1,2,3]will only select the p orbitals whileorbitals=[4,5,6,7,8]will select the d orbitals.default: The default is set to select all the orbitals
- param bands_spin
refer to
spinin bandsplotdefault:
bands_spin=0- param bands_separate
refer to
separatein bandsplot- param dos_spins
dos_spinsrepresents the the spins asked to be plotted. By convention we consider 0 to be spin up and 1 to be spin down.dos_spinshas to be and array.examples:
dos_spins=[0],dos_spins=[1],dos_spins=[0,1]default:
dos_spins=[0,1]- param dos_labels
dos_labelsdefine the legends plotted in defining each spin.examples:
dos_labels=['Oxygen-Up','Oxygen-Down'],dos_labels=['Oxygen-'+r'$\uparrow$','Oxygen-'+r'$\downarrow$']Side note, r means the string will be treated as raw string. This has to be used if LaTex formating is used.default: No default is used in the
dos_mode=plain,dos_mode=parametric,dos_mode=parametric_line. Indos_mode=stack,dos_mode=stack_species,dos_mode=stack_orbitalsthe labels are generated automatically based on the other parameters such as atoms, orbitals- param dos_spin_colors
dos_spin_colorsrepresent the colors the different spin ploarizations are going to be represented in the DOS plot. These colors can be chosen from any type of color acceptable by matplotlib(string,rgb,html).examples:
dos_spin_colors=['blue','red'],dos_spin_colors=[(0, 0, 1),(1, 0,0 )],dos_spin_colors=['#0000ff','#ff0000']default:
dos_spin_colors=['blue','red']Caution
If the calculation is spin polarized one has to provide two colors even if one is plotting one spin. I disregard this cation if using default.
- param dos_colors
dos_colorsdefines the color of plots filling the area under the curve of Total density of states. This is only important in thedos_mode=stack,dos_mode=stack_species,dos_mode=stack_orbitals. To have a better sense of this parameter refer to the stack plots of SrVO3. These colors can be chosen from any type of color acceptable by matplotlib(string,rgb,html).examples:
dos_colors=['blue','green','red','gray','orange','cyan','magenta']default:
dos_colors=['red','green','blue','cyan','magenta','yellow','orange','purple','brown','navy','maroon','olive']Caution
If the colors is defined, it has to be a python list(or numpy array) with enough elements that can cover the number of items being plotted in stack verion
- param dos_items
dos_itemsis only relavent fordos_mode='stack'. stack will plot the items defined with stacked filled areas under curve. For clarification visit the examples in the tutorial.dos_itemsneed to be provided as a python dictionary, with keys being specific species and values being projections oforbitals. The following examples can clarify the python lingo.examples:
dos_items={'Sr':[0],'O':[1,2,3],'V':[4,5,6,7,8]}ordos_items=dict(Sr=[0],O=[1,2,3],V=[4,5,6,7,8]). The two examples are equivalent to each other. This will plot the following curves stacked on top of each other. projection of s orbital in Sr, projection of p orbitals in O and projection of d orbitals in V.defalut: The default is set to take every atom and every orbital. Which will be equivalent to
dos_mode='stack_species'- param elimit
Energy window limit asked to plot.
elimithas to be a two element python list(or numpy array).elimitis shared between DOS and bands.example:
elimit=[-2,2]default:
elimit=[emin,emax]- param vmax
The maximum value in the color bar.
cmapis only relevant indos_mode='parametric'orbands_mode='parametric'example:
vmax=0.7default: defined by the bands plot
- param vmin
The maximum value in the color bar.
cmapis only relevant indos_mode='parametric'orbands_mode='parametric'.example:
vmin=-1.0default: defined by the bands plot
- param cmap
The color map used for color coding the projections.
cmapis only relevant inmode='parametric'. a full list of color maps is matplotlib are provided in this web page. <https://matplotlib.org/2.0.1/users/colormaps.html>_example:
cmap='plasma'default:
cmap='jet'- param grid
Defines If a grid is plotted in the plot. The entry should be python boolian.
examples:
grid=True,grid=Falsedafault:
grid=True- param kpointsfile
kpointsfileis specific to bands plot. PyProcar useskpointsfileto extract the high symmetry points and the path in which the calculation has been carried out in vasp. This variable is only relavent incode='vasp'.- param code
Defines the Density Functional Theory code used for the calculation. The default of this argument is vasp, so if the calculation is done in vasp one does not need to define this argumnet.
examples:
code=vasp,code=elk,code=abinitdefault:
code=vasp- param savefig
savefigdefines the file that the plot is going to be saved in.savefigaccepts all the formats accepted by matplotlib such as png, pdf, jpg, … savefig=None. If not provided the plot will be shown in the interactive matplotlib mode.examples:
savefig='bands-DOS.png',savefig='bands-DOS.pdf'defaults: No default is set for this parameter
- param title
Defines the plot title asked to be added above the plot. If
titleis not defined, PyProcar will not add any title.examples:
title="Band Structure and DOS of SrVO_$3$". One can use LaTex format as well.dafault: No default is set for this parameter.
- param plot_total
If the total density of states is plotted as well as other options. The entry should be python boolian.
examples:
plot_total=True,plot_total=Falsedefault:
plot_total=True- param kdirect
Please refere to bands plot for more information.
Modes and examples
One has multiple options for parameters bands_mode and dos_mode. The can be any combination of the differnt modes, such as (bands_mode='plain', dos_mode='plain'), (bands_mode='parametric', dos_mode='parametric'),(bands_mode='plain', dos_mode='stack_orbitals'), …. We have selected three examples from this combination.
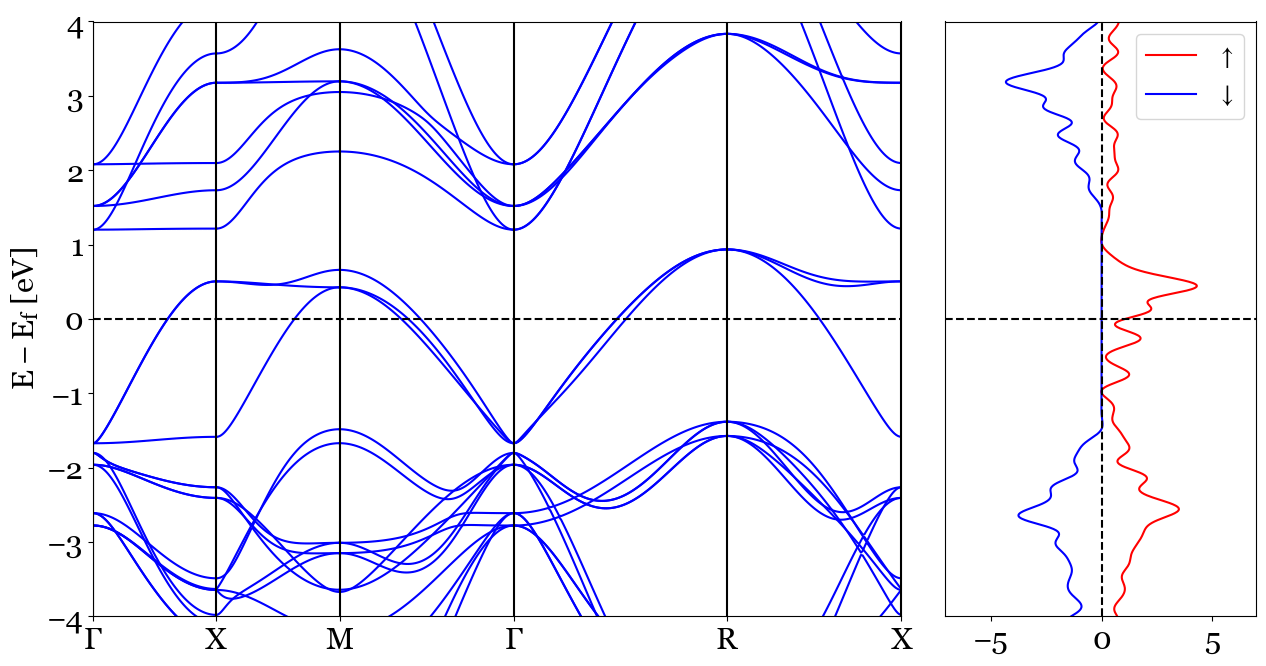
1. dos_mode='plain', bands_mode='plain'
The first combination is going to plot two plain plots of Bands and Density of States. As an example it can be noticed that the OUTCAR chosen for the determining the fermi energy of the bands structure is selected from the Density of States calculations Usage:
pyprocar.bandsdosplot(bands_file='SrVO3_BANDS/PROCAR',
                      outcar='SrVO3_DOS/OUTCAR',
                      dos_file='SrVO3_DOS/vasprun.xml',
                      bands_mode='plain',
                      dos_mode='plain',
                      dos_labels=[r'$\uparrow$',r'$\downarrow$'],
                      elimit=[-4,4],
                      kpointsfile='SrVO3_BANDS/KPOINTS')
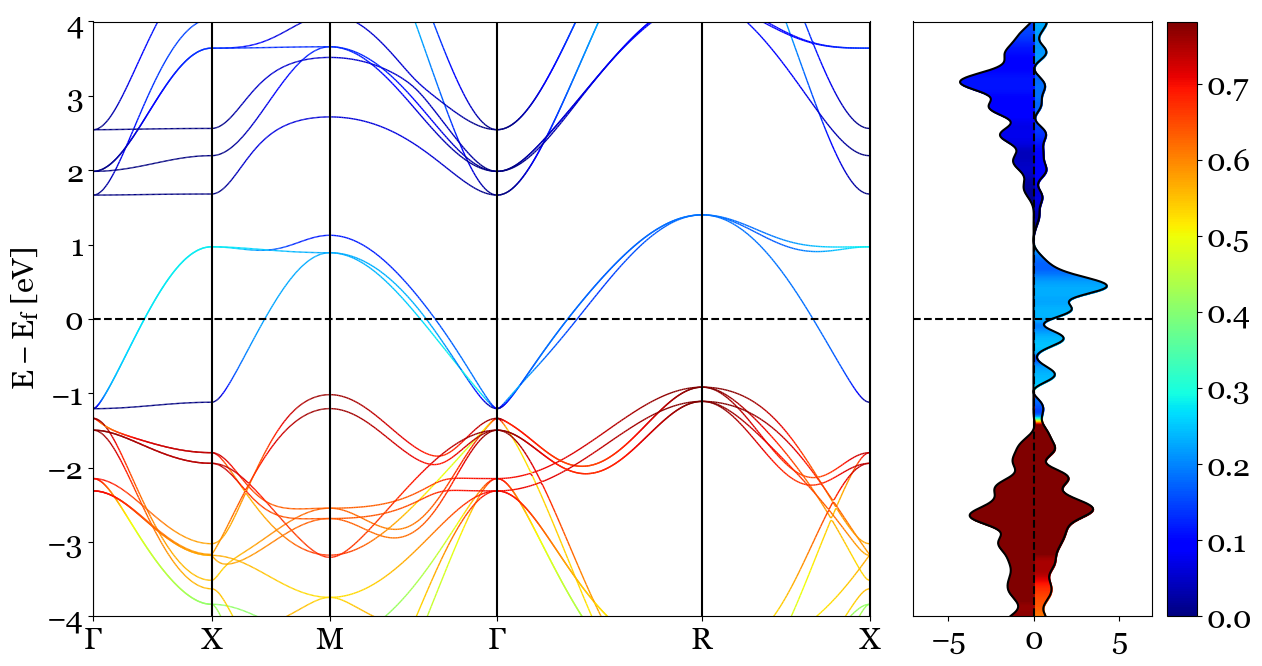
2. dos_mode='parametric', bands_mode='parametric'
This mode will use color coding for the projection of the orbitals to bands and density of states. atoms and orbitals are the main argument of this mode. The projection for Density of States and Bands Structure are the same. For mode information please check the bands andensity of states plot functions in PyProcar,
This mode will use color coding to illustrate the projection of atoms and orbitals asked to be projected. The following will plot shows the projection of p orbitals(orbitals=[1,2,3]) of O(atoms=[2,3,4]) in SrVO3
Usage:
pyprocar.bandsdosplot(bands_file='SrVO3_BANDS/PROCAR',
                    outcar='SrVO3_BANDS/OUTCAR',
                    dos_file='SrVO3_DOS/vasprun.xml',
                    bands_mode='parametric',
                    dos_mode='parametric',
                    atoms=[2, 3, 4],
                    orbitals=[1, 2, 3],
                    elimit=[-4, 4],
                    kpointsfile='SrVO3_BANDS/KPOINTS',
)
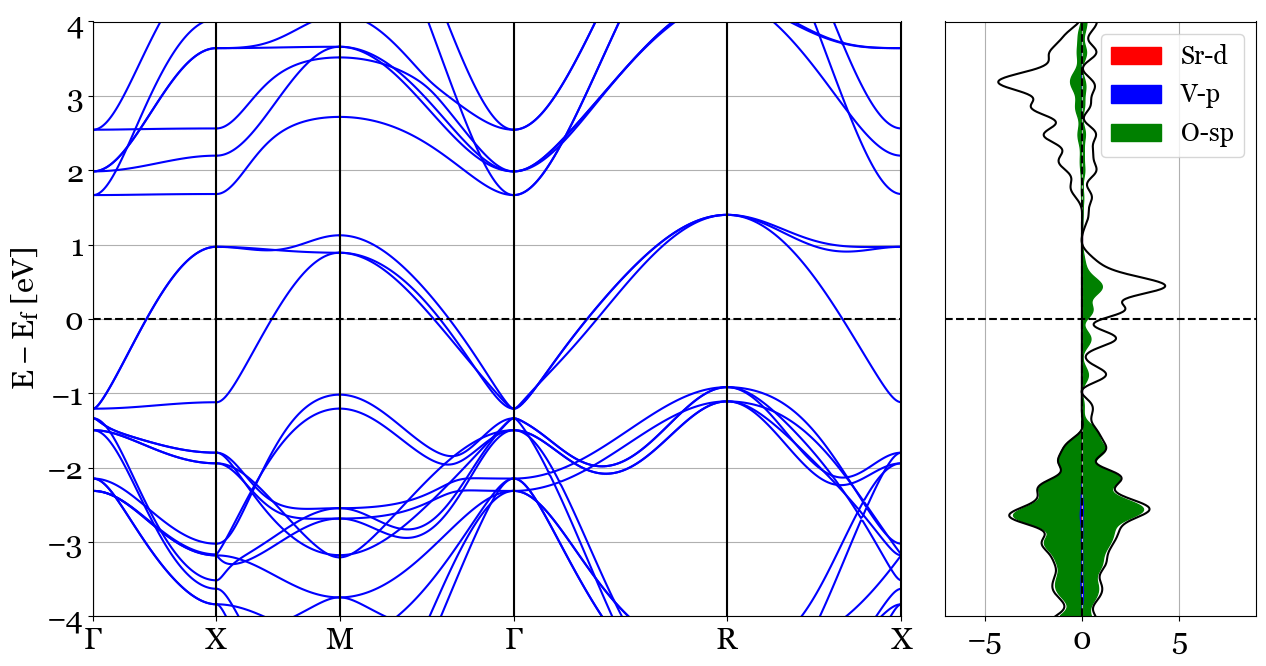
3. dos_mode='stack', bands_mode='plain'
This choice plots a plain bands structure with not projections. Density of States however is going to be plotted based on the parameters provided for dos_mode='stack'.
This mode plots the contribution of the species and their specified orbitals as stacked curves with filled areas under the curves for DOS. The following example represents the stacked projected DOS of d orbitals of Sr(Sr=[4,5,6,7,8]), p orbitals of O(O=[1,2,3]) and the s and p orbitals of V(V=[0,1,2,3]). The bands plot will be a simple plain bands plot.
Usage:
pyprocar.bandsdosplot(bands_file=procar_bands,
                      outcar=outcar_bands,
                      dos_file=vasprun,
                      dos_items=dict(Sr=[4,5,6,7,8],V=[1,2,3],O=[0,1,2,3]),
                      bands_mode='plain',
                      dos_mode='stack',
                      elimit=[-4,4],
                      kpointsfile='SrVO3_BANDS'+os.sep+'KPOINTS',
                      grid=True,
                      )
Created on May 17 2020 @author: Pedram Tavadze
- pyprocar.scriptBandsDosplot.bandsdosplot(bands_file='PROCAR', dos_file='vasprun.xml', dos_dirname=None, bands_dirname=None, outcar='OUTCAR', abinit_output=None, bands_mode='plain', dos_mode='plain', plot_total=True, fermi=None, mask=None, markersize=0.02, marker='o', atoms=None, orbitals=None, bands_spin=0, bands_separate=False, dos_spins=None, dos_labels=None, dos_spin_colors=[(1, 0, 0), (0, 0, 1)], dos_colors=None, dos_items=None, dos_interpolation_factor=None, dlimit=None, elimit=None, vmin=None, vmax=None, cmap='jet', grid=False, kpointsfile='KPOINTS', code='vasp', savefig=None, title=None, kdirect=True, discontinuities=None, plot_color_bar=True, repair=True, show=True)[source]
This function creates plots containing both DOS and bands.