Note
Go to the end to download the full example code.
Plotting 2D band structure#
Plotting 2D band structure example.
First, specify the data directory where the band structure data is located.
Downloading example#
 data_dir = pyprocar.download_example(save_dir='',
                             material='graphene',
                             code='vasp',
                             spin_calc_type='non-spin-polarized',
                             calc_type='2d_bands')
importing pyprocar and specifying local data_dir
import os

import pyprocar

data_dir = os.path.join(
    pyprocar.utils.DATA_DIR,
    "examples",
    "graphene",
    "vasp",
    "non-spin-polarized",
    "2d_bands",
)
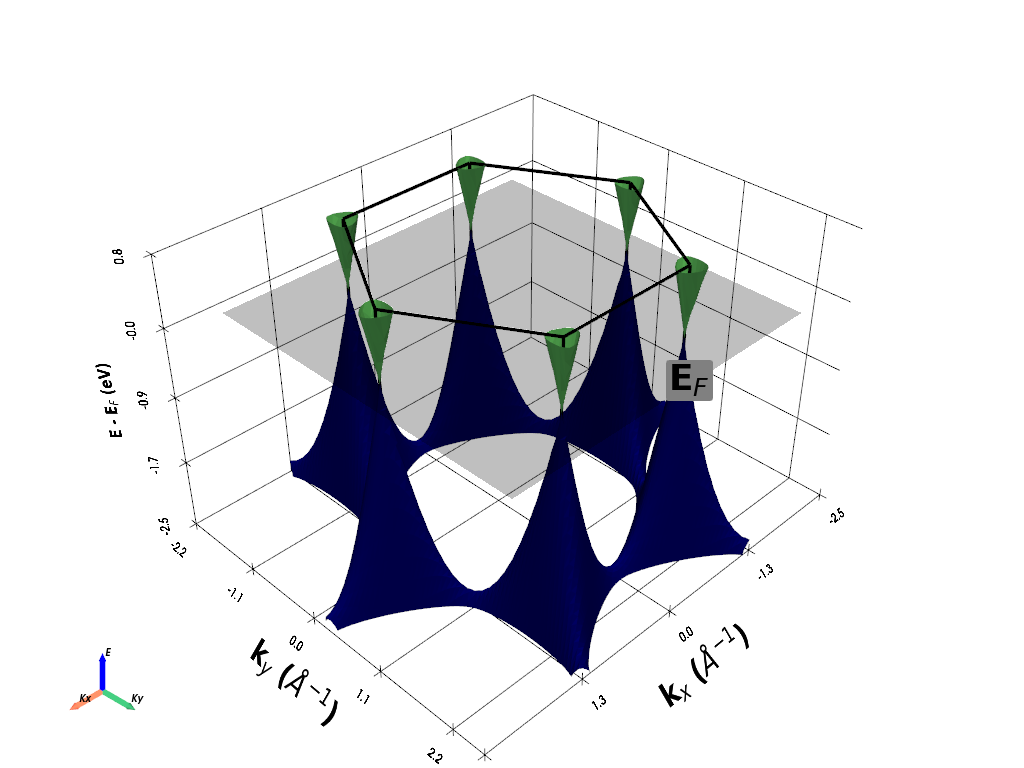
Plain mode#
spins = [0]
handler = pyprocar.BandStructure2DHandler(
    code="vasp",
    dirname=data_dir,
    fermi=-0.795606,
    apply_symmetry=False,
)
handler.plot_band_structure(
    mode="plain",
    add_fermi_plane=True,
    bands=[3, 4],
    fermi_plane_size=4,
    energy_lim=[-2.5, 0.8],
    extended_zone_directions=[
        [1, 0, 0],
        [0, 1, 0],
        [-1, 0, 0],
        [0, -1, 0],
        [1, -1, 0],
        [-1, 1, 0],
        [-1, -1, 0],
        [[1, 1, 0]],
    ],
    spins=spins,
)
                ----------------------------------------------------------------------------------------------------------
                There are additional plot options that are defined in a configuration file.
                You can change these configurations by passing the keyword argument to the function
                To print a list of plot options set print_plot_opts=True

                Here is a list modes : plain , parametric , spin_texture , overlay
                Here is a list of properties: fermi_speed , fermi_velocity , harmonic_effective_mass
                ----------------------------------------------------------------------------------------------------------


            WARNING : Make sure the kmesh has kz points with kz=0 +- 0.0001
            ----------------------------------------------------------------------------------------------------------

C:\Users\lllang\miniconda3\envs\pyprocar_dev\lib\site-packages\pyvista\core\utilities\points.py:55: UserWarning: Points is not a float type. This can cause issues when transforming or applying filters. Casting to ``np.float32``. Disable this by passing ``force_float=False``.
  warnings.warn(
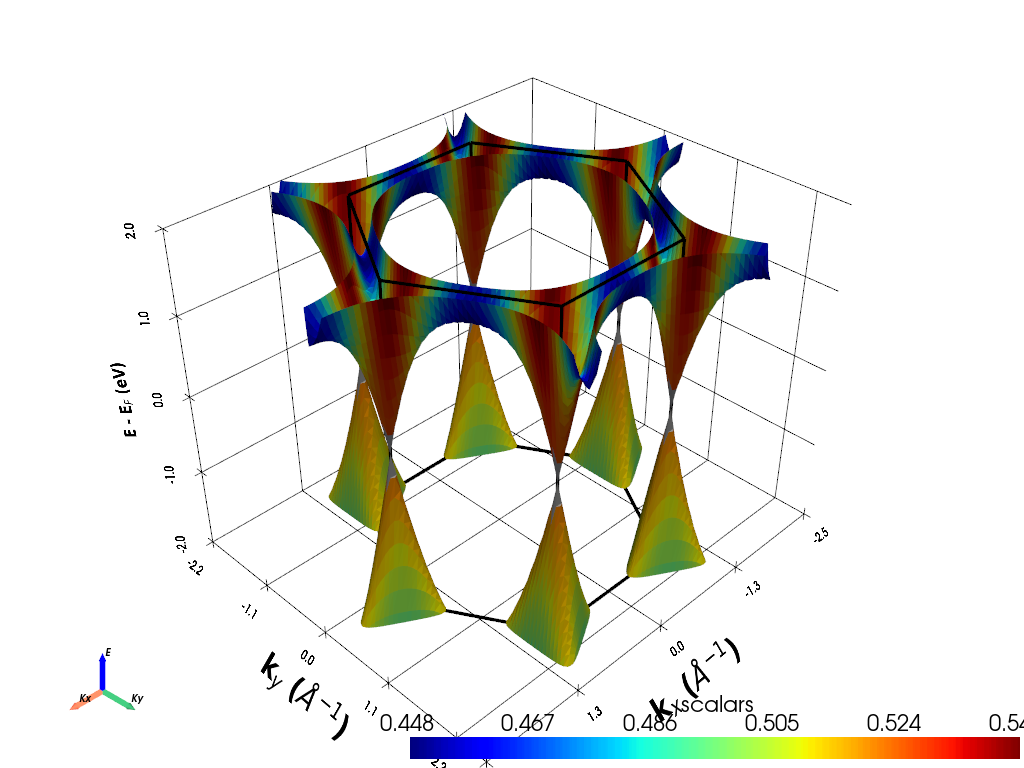
Parametric mode#
atoms = [0, 1]
orbitals = [1, 2, 3]
spins = [0]
handler = pyprocar.BandStructure2DHandler(
    code="vasp", dirname=data_dir, fermi=-0.795606, apply_symmetry=False
)
handler.plot_band_structure(
    mode="parametric", atoms=atoms, orbitals=orbitals, spins=spins
)
    ----------------------------------------------------------------------------------------------------------
    There are additional plot options that are defined in a configuration file.
    You can change these configurations by passing the keyword argument to the function
    To print a list of plot options set print_plot_opts=True

    Here is a list modes : plain , parametric , spin_texture , overlay
    Here is a list of properties: fermi_speed , fermi_velocity , harmonic_effective_mass
    ----------------------------------------------------------------------------------------------------------


WARNING : Make sure the kmesh has kz points with kz=0 +- 0.0001
----------------------------------------------------------------------------------------------------------
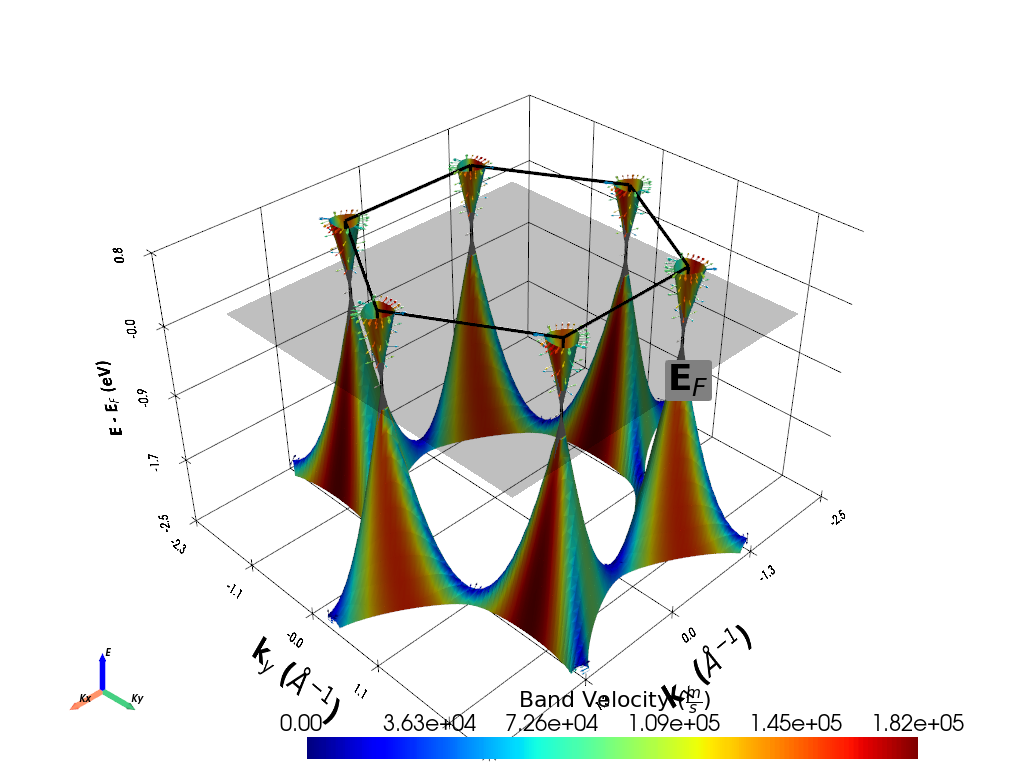
Property Projection mode#
handler = pyprocar.BandStructure2DHandler(
    code="vasp", dirname=data_dir, fermi=-0.795606, apply_symmetry=False
)
handler.plot_band_structure(
    mode="property_projection",
    property_name="band_velocity",
    bands=[3, 4],
    fermi_plane_size=4,
    scalar_bar_position_x=0.3,
    energy_lim=[-2.5, 0.8],
    scalar_bar_title=r"Band Velocity ($\frac{m}{s}$)",
    add_fermi_plane=True,
)
                ----------------------------------------------------------------------------------------------------------
                There are additional plot options that are defined in a configuration file.
                You can change these configurations by passing the keyword argument to the function
                To print a list of plot options set print_plot_opts=True

                Here is a list modes : plain , parametric , spin_texture , overlay
                Here is a list of properties: fermi_speed , fermi_velocity , harmonic_effective_mass
                ----------------------------------------------------------------------------------------------------------


            WARNING : Make sure the kmesh has kz points with kz=0 +- 0.0001
            ----------------------------------------------------------------------------------------------------------

ij,uvwabj->uvwabi
C:\Users\lllang\miniconda3\envs\pyprocar_dev\lib\site-packages\pyvista\core\utilities\points.py:55: UserWarning: Points is not a float type. This can cause issues when transforming or applying filters. Casting to ``np.float32``. Disable this by passing ``force_float=False``.
  warnings.warn(
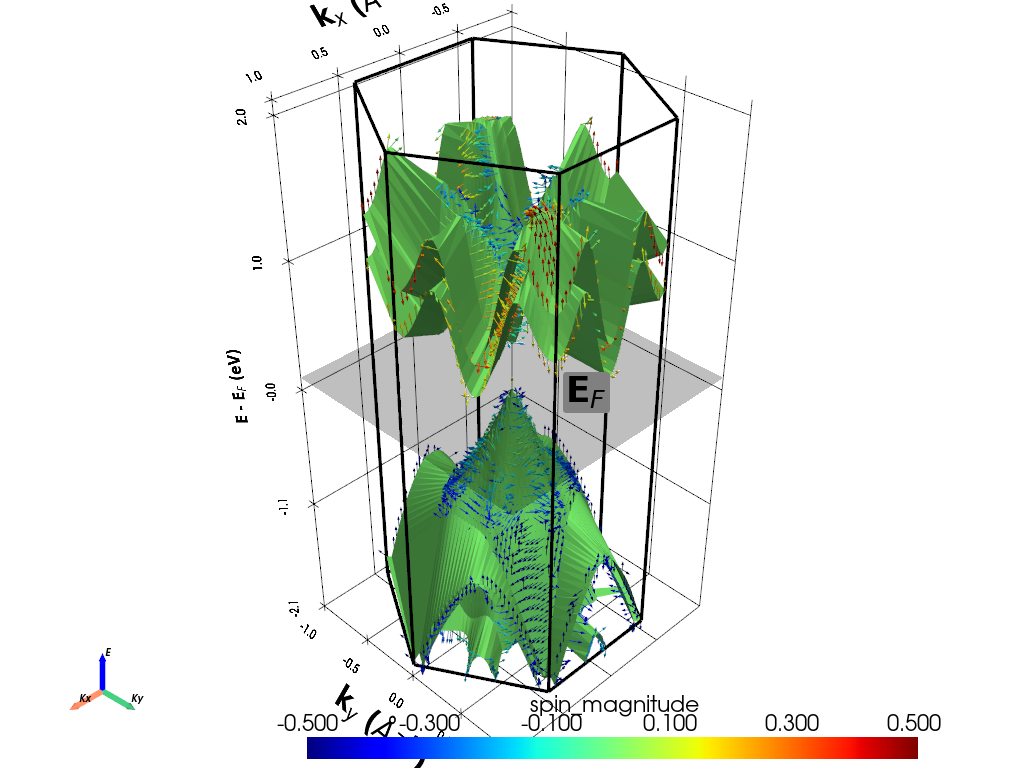
Spin Texture mode#
data_dir = os.path.join(
    pyprocar.utils.DATA_DIR,
    "examples",
    "BiSb_monolayer",
    "vasp",
    "non-colinear",
    "fermi",
)


atoms = [0]
orbitals = [4, 5, 6, 7, 8]
handler = pyprocar.BandStructure2DHandler(
    code="vasp", dirname=data_dir, fermi=-1.1904, apply_symmetry=False
)
handler.plot_band_structure(
    mode="spin_texture",
    spin_texture=True,
    atoms=atoms,
    orbitals=orbitals,
    add_fermi_plane=True,
    fermi_plane_size=2,
    energy_lim=[-2, 2],
    fermi_text_position=[0, 0.5, 0],
    scalar_bar_position_x=0.3,
    clip_brillouin_zone_factor=1,
    surface_clim=[-0.5, 0.5],
)
    ----------------------------------------------------------------------------------------------------------
    There are additional plot options that are defined in a configuration file.
    You can change these configurations by passing the keyword argument to the function
    To print a list of plot options set print_plot_opts=True

    Here is a list modes : plain , parametric , spin_texture , overlay
    Here is a list of properties: fermi_speed , fermi_velocity , harmonic_effective_mass
    ----------------------------------------------------------------------------------------------------------


WARNING : Make sure the kmesh has kz points with kz=0 +- 0.0001
----------------------------------------------------------------------------------------------------------
Total running time of the script: (2 minutes 44.356 seconds)