Note
Go to the end to download the full example code.
Plotting non colinear band structures in Quantum Espresso#
Plotting non colinear band structures in Quantum Espresso.
First download the example files with the code below. Then replace data_dir below.
Downloading example#
 data_dir = pyprocar.download_example(save_dir='',
                             material='Fe',
                             code='qe',
                             spin_calc_type='non-colinear',
                             calc_type='bands')
# sphinx_gallery_thumbnail_number = 2
importing pyprocar and specifying local data_dir
import os

import pyprocar

data_dir = os.path.join(
    pyprocar.utils.DATA_DIR, "examples", "Fe", "qe", "non-colinear", "bands"
)
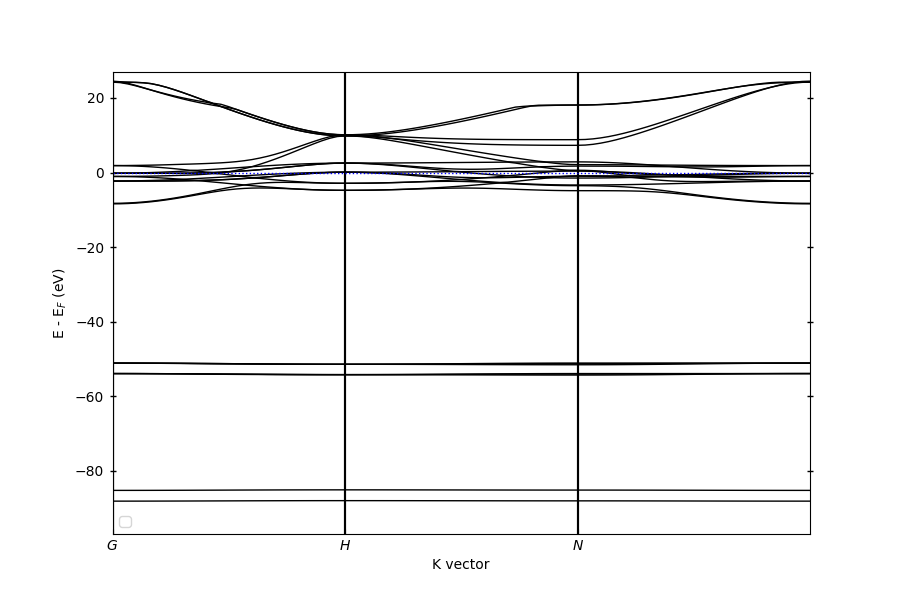
Plain mode#
pyprocar.bandsplot(code="qe", mode="plain", fermi=18.0536, dirname=data_dir)
            ----------------------------------------------------------------------------------------------------------
            There are additional plot options that are defined in the configuration file.
            You can change these configurations by passing the keyword argument to the function.
            To print a list of all plot options set `print_plot_opts=True`

            Here is a list modes : plain , parametric , scatter , atomic , overlay , overlay_species , overlay_orbitals
            ----------------------------------------------------------------------------------------------------------


(<Figure size 900x600 with 1 Axes>, <Axes: xlabel='K vector', ylabel='E - E$_F$ (eV)'>)
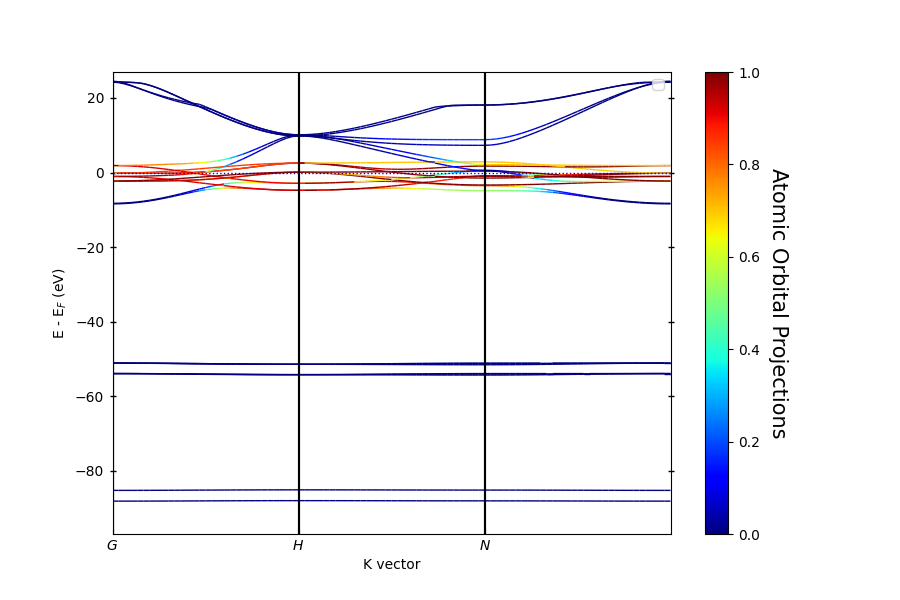
Parametric mode#
Quantum Espresso expresses the projections in the coupled basis, therefore orbitals takes different meanings. For details on the meaning of the indices of the atomic projection please refer to the user guide :ref:’atomic_projections’
atoms = [0]
spins = [0]
orbitals = [8, 9, 10, 11, 12, 13, 14, 15, 16, 17]

pyprocar.bandsplot(
    code="qe",
    mode="parametric",
    fermi=18.0536,
    atoms=atoms,
    orbitals=orbitals,
    spins=spins,
    dirname=data_dir,
)
            ----------------------------------------------------------------------------------------------------------
            There are additional plot options that are defined in the configuration file.
            You can change these configurations by passing the keyword argument to the function.
            To print a list of all plot options set `print_plot_opts=True`

            Here is a list modes : plain , parametric , scatter , atomic , overlay , overlay_species , overlay_orbitals
            ----------------------------------------------------------------------------------------------------------


(<Figure size 900x600 with 2 Axes>, <Axes: xlabel='K vector', ylabel='E - E$_F$ (eV)'>)
Total running time of the script: (0 minutes 1.505 seconds)