Note
Go to the end to download the full example code.
Example of kpath_generator#
In order to plot a band structure, one must define a set of
pyprocar.kpath(infile, outfile, grid-size, with-time-reversal, recipe, threshold, symprec, angle-tolerance,supercell_matrix)
First download the example files with the code below. Then replace data_dir below.
 data_dir = pyprocar.download_example(save_dir='',
                             material='Fe',
                             code='vasp',
                             spin_calc_type='non-spin-polarized',
                             calc_type='bands')
This information is automatically written to a KPOINTS file. The retrieved
More details regarding these parameters can be found in the SeeK-path manual.
The
Y. Hinuma, G. Pizzi, Y. Kumagai, F. Oba, I. Tanaka, Band structure diagram paths based on crystallography, Computational Materials Science 128 (2017) 140–184.doi:10.1016/j.commatsci.2016.10.015.
# sphinx_gallery_thumbnail_number = 1
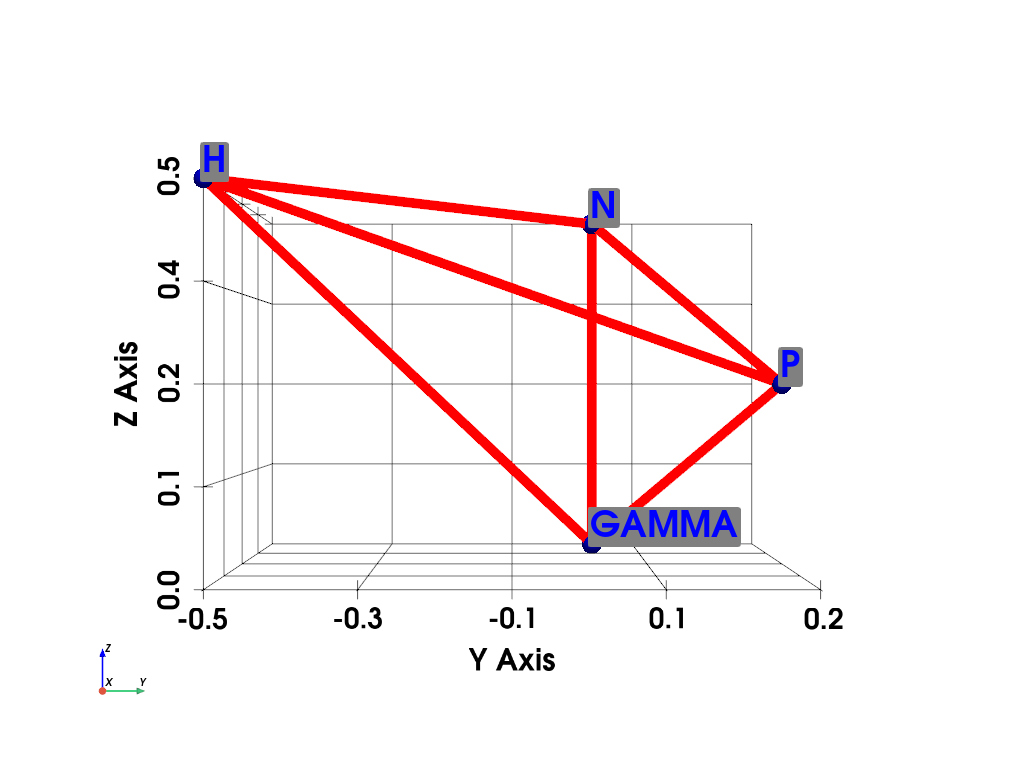
Plotting K Path#
import pyvista

# You do not need this. This is to ensure an image is rendered off screen when generating exmaple gallery.
pyvista.OFF_SCREEN = True
importing pyprocar and specifying local data_dir
import os

import numpy as np

import pyprocar

data_dir = os.path.join(
    pyprocar.utils.DATA_DIR,
    "examples",
    "Fe",
    "vasp",
    "spin-polarized-colinear",
    "bands",
)

poscar = os.path.join(data_dir, "POSCAR")

k_path, k_labels = pyprocar.kpath(
    poscar, "KPOINTS", 40, True, "hpkot", 1e-07, 1e-05, -1.0, np.eye(3)
)


# Getting unique points for plotting
unique_labels = []
unique_kpath = []
for i, k_label in enumerate(k_labels):
    if k_label not in unique_labels:
        unique_labels.append(k_label)
        unique_kpath.append(k_path[i])


plotter = pyvista.Plotter()

# plotting connecting lines
for ik, points in enumerate(k_path):
    if ik == len(k_path) - 1:
        plotter.add_lines(np.array([k_path[ik - 1], k_path[ik]]), color="red", width=10)
    else:
        plotter.add_lines(np.array([k_path[ik], k_path[ik + 1]]), color="red", width=10)

# plotting points and labels
plotter.add_point_labels(
    unique_kpath,
    unique_labels,
    point_color="blue",
    text_color="blue",
    render_points_as_spheres=True,
    point_size=20,
    font_size=36,
    always_visible=True,
)
plotter.show_axes()
plotter.show_grid()
plotter.view_yz()
plotter.show()
 ____        ____
|  _ \ _   _|  _ \ _ __ ___   ___ __ _ _ __
| |_) | | | | |_) | '__/ _ \ / __/ _` | '__|
|  __/| |_| |  __/| | | (_) | (_| (_| | |
|_|    \__, |_|   |_|  \___/ \___\__,_|_|
       |___/
A Python library for electronic structure pre/post-processing.

Version 6.3.2 created on Jun 10th, 2021

Please cite:
 Uthpala Herath, Pedram Tavadze, Xu He, Eric Bousquet, Sobhit Singh, Francisco Muñoz and Aldo Romero.,
 PyProcar: A Python library for electronic structure pre/post-processing.,
 Computer Physics Communications 251 (2020):107080.


Developers:
- Francisco Muñoz
- Aldo Romero
- Sobhit Singh
- Uthpala Herath
- Pedram Tavadze
- Eric Bousquet
- Xu He
- Reese Boucher
- Logan Lang
- Freddy Farah

C:\Users\lllang\miniconda3\envs\pyprocar_dev\lib\site-packages\spglib\spglib.py:115: DeprecationWarning: dict interface (SpglibDataset['std_lattice']) is deprecated.Use attribute interface ({self.__class__.__name__}.{key}) instead
  warnings.warn(
C:\Users\lllang\miniconda3\envs\pyprocar_dev\lib\site-packages\spglib\spglib.py:115: DeprecationWarning: dict interface (SpglibDataset['std_positions']) is deprecated.Use attribute interface ({self.__class__.__name__}.{key}) instead
  warnings.warn(
C:\Users\lllang\miniconda3\envs\pyprocar_dev\lib\site-packages\spglib\spglib.py:115: DeprecationWarning: dict interface (SpglibDataset['std_types']) is deprecated.Use attribute interface ({self.__class__.__name__}.{key}) instead
  warnings.warn(
C:\Users\lllang\miniconda3\envs\pyprocar_dev\lib\site-packages\spglib\spglib.py:115: DeprecationWarning: dict interface (SpglibDataset['number']) is deprecated.Use attribute interface ({self.__class__.__name__}.{key}) instead
  warnings.warn(
C:\Users\lllang\miniconda3\envs\pyprocar_dev\lib\site-packages\spglib\spglib.py:115: DeprecationWarning: dict interface (SpglibDataset['transformation_matrix']) is deprecated.Use attribute interface ({self.__class__.__name__}.{key}) instead
  warnings.warn(
C:\Users\lllang\miniconda3\envs\pyprocar_dev\lib\site-packages\spglib\spglib.py:115: DeprecationWarning: dict interface (SpglibDataset['international']) is deprecated.Use attribute interface ({self.__class__.__name__}.{key}) instead
  warnings.warn(
C:\Users\lllang\miniconda3\envs\pyprocar_dev\lib\site-packages\spglib\spglib.py:115: DeprecationWarning: dict interface (SpglibDataset['std_rotation_matrix']) is deprecated.Use attribute interface ({self.__class__.__name__}.{key}) instead
  warnings.warn(
Total running time of the script: (0 minutes 0.449 seconds)