Note
Go to the end to download the full example code.
Plotting with Configurations in pyprocar#
This example illustrates how to utilize various configurations for plotting band structures using the pyprocar package. It provides a structured way to explore and demonstrate different configurations for the bandsplot function.
Preparation#
Before diving into plotting, we need to download the example files. Use the following code to do this. Once downloaded, specify the data_dir to point to the location of the downloaded data.
Downloading example#
 import pyprocar

 data_dir = pyprocar.download_example(
                             save_dir='',
                             material='Fe',
                             code='vasp',
                             spin_calc_type='spin-polarized-colinear',
                             calc_type='bands'
                            )
import os

import pyprocar

# Define the directory containing the example data

data_dir = os.path.join(
    pyprocar.utils.DATA_DIR,
    "examples",
    "Fe",
    "vasp",
    "spin-polarized-colinear",
    "bands",
)
code = "vasp"
spins = [0, 1]
# Section 1: Locating and Printing Configuration Files
# ++++++++++++++++++++++++++++++++++++++++++++++++++++++++++++++++++++++++++++++
#
# This section demonstrates where the configuration files are located in the package.
# It also shows how to print the configurations by setting print_plot_ops=True.
#

# Path to the configuration files in the package
config_path = os.path.join(pyprocar.__path__[0], "cfg")
print(f"Configuration files are located at: {config_path}")

# Print the configurations
pyprocar.bandsplot(code=code, dirname=data_dir, fermi=5.590136, print_plot_opts=True)
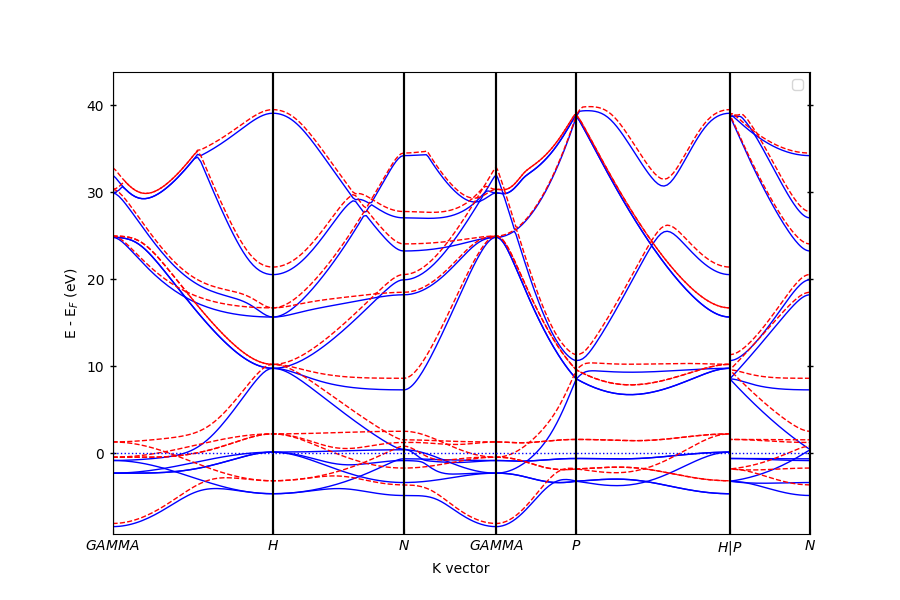
Configuration files are located at: C:\Users\lllang\Desktop\Current_Projects\pyprocar\pyprocar\cfg

            ----------------------------------------------------------------------------------------------------------
            There are additional plot options that are defined in the configuration file.
            You can change these configurations by passing the keyword argument to the function.
            To print a list of all plot options set `print_plot_opts=True`

            Here is a list modes : plain , parametric , scatter , atomic , overlay , overlay_species , overlay_orbitals
            ----------------------------------------------------------------------------------------------------------

plot_type : PlotType.BAND_STRUCTURE
custom_settings : {}
modes : ['plain', 'parametric', 'scatter', 'atomic', 'overlay', 'overlay_species', 'overlay_orbitals']
color : black
spin_colors : ('blue', 'red')
colorbar_title : Atomic Orbital Projections
colorbar_title_size : 15
colorbar_title_padding : 20
colorbar_tick_labelsize : 10
cmap : jet
clim : (0.0, 1.0)
fermi_color : blue
fermi_linestyle : dotted
fermi_linewidth : 1
grid : False
grid_axis : both
grid_color : grey
grid_linestyle : solid
grid_linewidth : 1
grid_which : major
label : ('$\\uparrow$', '$\\downarrow$')
legend : True
linestyle : ('solid', 'dashed')
linewidth : (1.0, 1.0)
marker : ('o', 'v', '^', 'D')
markersize : (0.2, 0.2)
opacity : (1.0, 1.0)
plot_color_bar : True
savefig : None
title : None
weighted_color : True
weighted_width : False
figure_size : (9, 6)
dpi : figure
colorbar_tick_params : {}
colorbar_label_params : {}
x_label_params : {}
y_label_params : {}
title_params : {}
major_y_tick_params : {'which': 'major', 'axis': 'y', 'direction': 'inout', 'width': 1, 'length': 5, 'labelright': False, 'right': True, 'left': True}
minor_y_tick_params : {'which': 'minor', 'axis': 'y', 'direction': 'in', 'left': True, 'right': True}
major_x_tick_params : {'which': 'major', 'axis': 'x', 'direction': 'in'}
multiple_locator_y_major_value : None
multiple_locator_y_minor_value : None

(<Figure size 900x600 with 1 Axes>, <Axes: xlabel='K vector', ylabel='E - E$_F$ (eV)'>)
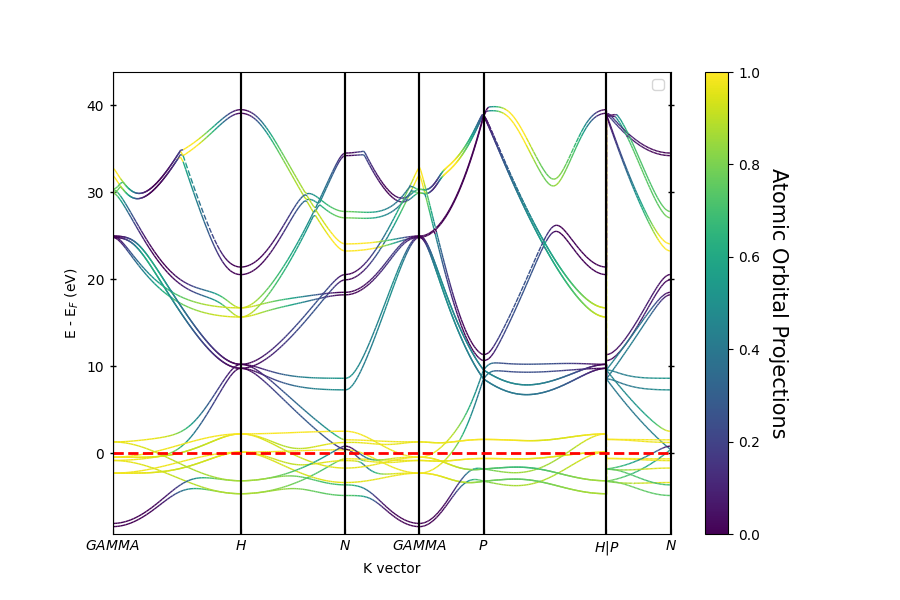
# Section 2: Changing cmap, clim, and Fermi line properties in Parametric Mode
# ++++++++++++++++++++++++++++++++++++++++++++++++++++++++++++++++++++++++++++++
#
# This section demonstrates how to change the colormap (cmap), color limits (clim),
# and Fermi line properties (color, linestyle, and linewidth) in parametric mode.
#

pyprocar.bandsplot(
    code=code,
    dirname=data_dir,
    mode="parametric",
    fermi=5.590136,
    atoms=[0],
    orbitals=[4, 5, 6, 7, 8],
    cmap="viridis",  # Colormap
    clim=[0, 1],  # Color limits
    fermi_color="red",  # Fermi line color
    fermi_linestyle="--",  # Fermi line linestyle
    fermi_linewidth=2.0,  # Fermi line linewidth
)
            ----------------------------------------------------------------------------------------------------------
            There are additional plot options that are defined in the configuration file.
            You can change these configurations by passing the keyword argument to the function.
            To print a list of all plot options set `print_plot_opts=True`

            Here is a list modes : plain , parametric , scatter , atomic , overlay , overlay_species , overlay_orbitals
            ----------------------------------------------------------------------------------------------------------


(<Figure size 900x600 with 2 Axes>, <Axes: xlabel='K vector', ylabel='E - E$_F$ (eV)'>)
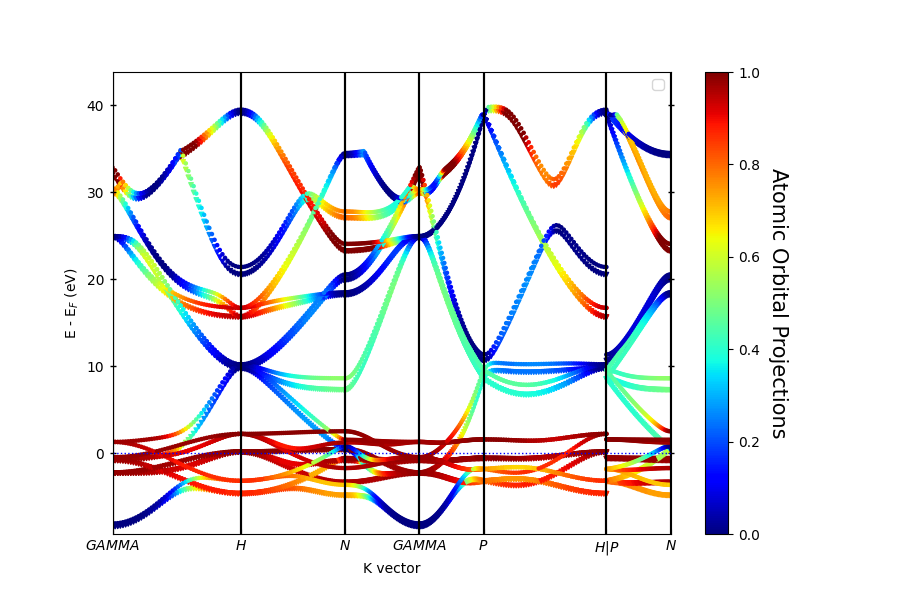
# Section 3: Setting Marker and Marker Size in Scatter Mode
# ++++++++++++++++++++++++++++++++++++++++++++++++++++++++++++++++++++++++++++++
#
# This section demonstrates how to set the marker style and marker size in scatter mode.
#

pyprocar.bandsplot(
    code=code,
    dirname=data_dir,
    mode="scatter",
    fermi=5.590136,
    atoms=[0],
    orbitals=[4, 5, 6, 7, 8],
    marker=["v", "o"],  # Marker style
    markersize=[10, 5],  # Marker size list for the 2 spin plots
)
            ----------------------------------------------------------------------------------------------------------
            There are additional plot options that are defined in the configuration file.
            You can change these configurations by passing the keyword argument to the function.
            To print a list of all plot options set `print_plot_opts=True`

            Here is a list modes : plain , parametric , scatter , atomic , overlay , overlay_species , overlay_orbitals
            ----------------------------------------------------------------------------------------------------------


(<Figure size 900x600 with 2 Axes>, <Axes: xlabel='K vector', ylabel='E - E$_F$ (eV)'>)
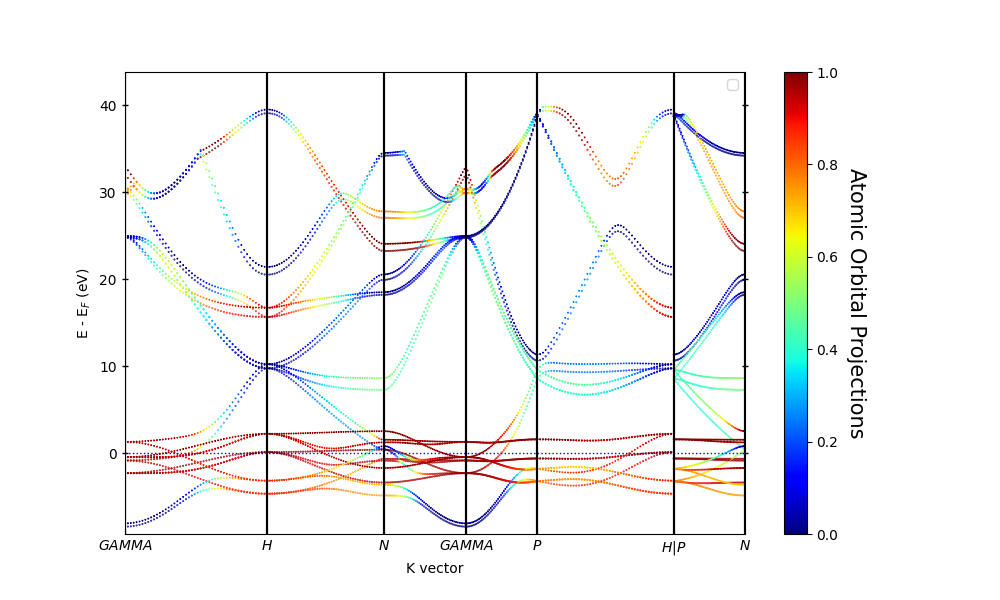
# Section 4: Setting the Figure Size and DPI
# ++++++++++++++++++++++++++++++++++++++++++++++++++++++++++++++++++++++++++++++
#
# This section demonstrates how to set the figure size and dots per inch (DPI) for the plot.
#

pyprocar.bandsplot(
    code=code,
    dirname=data_dir,
    mode="scatter",
    fermi=5.590136,
    atoms=[0],
    orbitals=[4, 5, 6, 7, 8],
    figure_size=(10, 6),  # Figure size (width, height)
    dpi=300,  # Dots per inch
)
            ----------------------------------------------------------------------------------------------------------
            There are additional plot options that are defined in the configuration file.
            You can change these configurations by passing the keyword argument to the function.
            To print a list of all plot options set `print_plot_opts=True`

            Here is a list modes : plain , parametric , scatter , atomic , overlay , overlay_species , overlay_orbitals
            ----------------------------------------------------------------------------------------------------------


(<Figure size 1000x600 with 2 Axes>, <Axes: xlabel='K vector', ylabel='E - E$_F$ (eV)'>)
Total running time of the script: (0 minutes 2.433 seconds)