Note
Go to the end to download the full example code.
Plotting density of states#
Plotting density example.
First download the example files with the code below. Then replace data_dir below.
Downloading example#
 data_dir = pyprocar.download_example(save_dir='',
                             material='SrVO3',
                             code='vasp',
                             spin_calc_type='non-spin-polarized',
                             calc_type='fermi')
importing pyprocar and specifying local data_dir
import os

import pyprocar

data_dir = os.path.join(
    pyprocar.utils.DATA_DIR, "examples", "SrVO3", "vasp", "non-spin-polarized", "fermi"
)
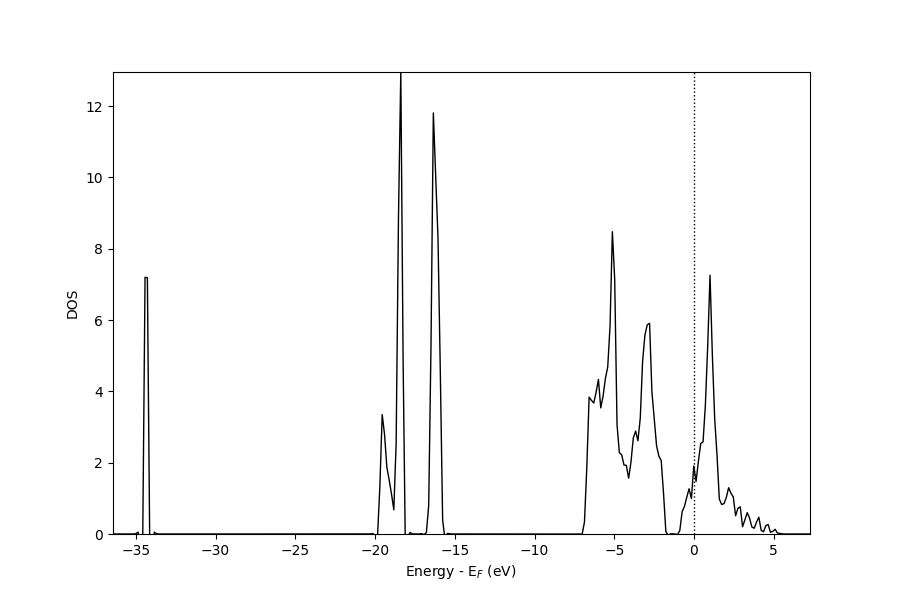
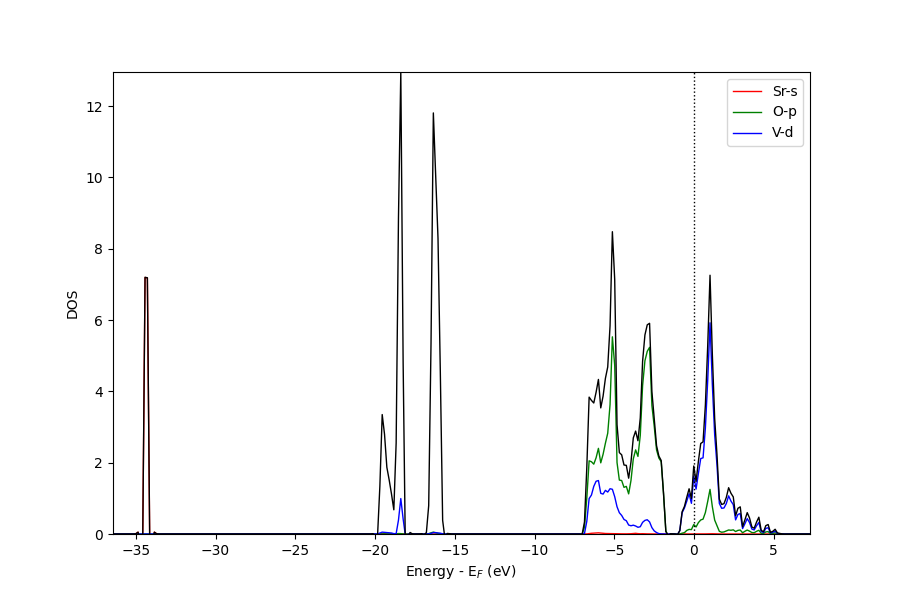
Plain mode#
pyprocar.dosplot(code="vasp", mode="plain", fermi=5.3017, dirname=data_dir)
            --------------------------------------------------------
            There are additional plot options that are defined in a configuration file.
            You can change these configurations by passing the keyword argument to the function
            To print a list of plot options set print_plot_opts=True

            Here is a list modes : plain , parametric , parameteric_line , stack , stack_orbitals , stack_species , overlay , overlay_orbitals , overlay_species
            --------------------------------------------------------

(<Figure size 900x600 with 1 Axes>, <Axes: xlabel='Energy - E$_F$ (eV)', ylabel='DOS'>)
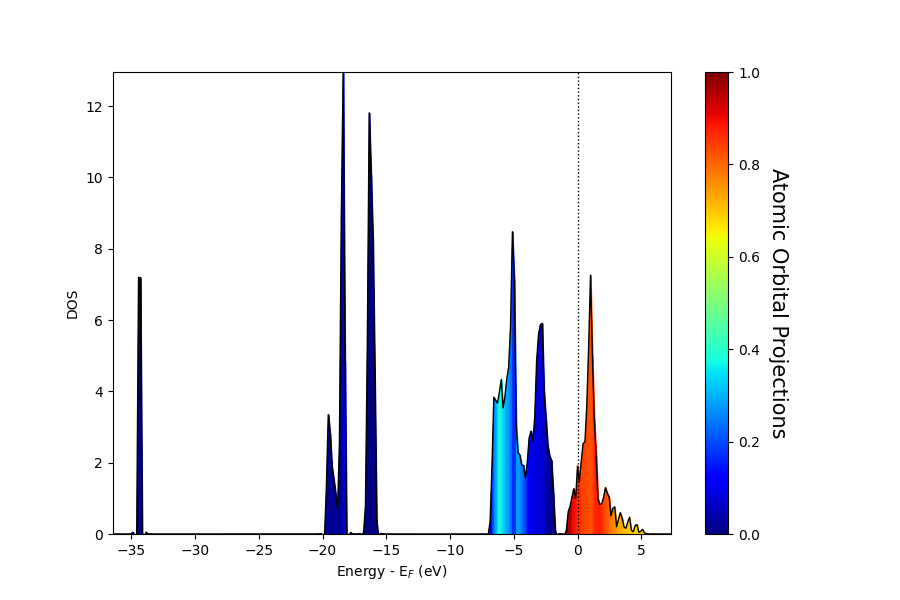
Parametric mode#
For details on the meaning of the indices of the atomic projection please refer to the user guide :ref:’atomic_projections’
atoms = [0, 1, 2, 3, 4]
orbitals = [4, 5, 6, 7, 8]
spins = [0]

pyprocar.dosplot(
    code="vasp",
    mode="parametric",
    fermi=5.3017,
    atoms=atoms,
    orbitals=orbitals,
    clim=[0, 1],
    spins=spins,
    dirname=data_dir,
)
            --------------------------------------------------------
            There are additional plot options that are defined in a configuration file.
            You can change these configurations by passing the keyword argument to the function
            To print a list of plot options set print_plot_opts=True

            Here is a list modes : plain , parametric , parameteric_line , stack , stack_orbitals , stack_species , overlay , overlay_orbitals , overlay_species
            --------------------------------------------------------

(<Figure size 900x600 with 2 Axes>, <Axes: xlabel='Energy - E$_F$ (eV)', ylabel='DOS'>)
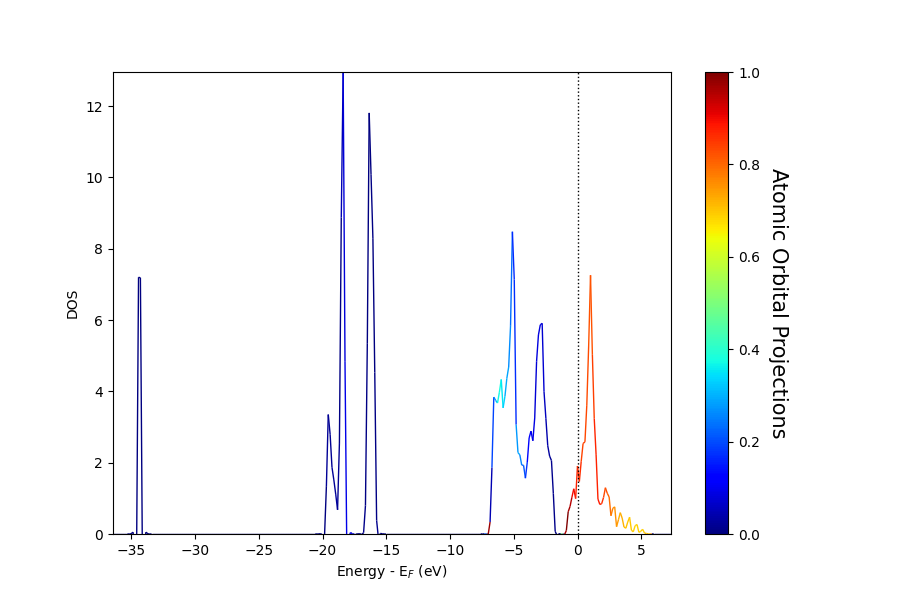
parametric_line mode#
For details on the meaning of the indices of the atomic projection please refer to the user guide :ref:’atomic_projections’
atoms = [0, 1, 2, 3, 4]
orbitals = [4, 5, 6, 7, 8]
spins = [0]

pyprocar.dosplot(
    code="vasp",
    mode="parametric_line",
    fermi=5.3017,
    atoms=atoms,
    orbitals=orbitals,
    clim=[0, 1],
    spins=spins,
    dirname=data_dir,
)
            --------------------------------------------------------
            There are additional plot options that are defined in a configuration file.
            You can change these configurations by passing the keyword argument to the function
            To print a list of plot options set print_plot_opts=True

            Here is a list modes : plain , parametric , parameteric_line , stack , stack_orbitals , stack_species , overlay , overlay_orbitals , overlay_species
            --------------------------------------------------------

(<Figure size 900x600 with 2 Axes>, <Axes: xlabel='Energy - E$_F$ (eV)', ylabel='DOS'>)
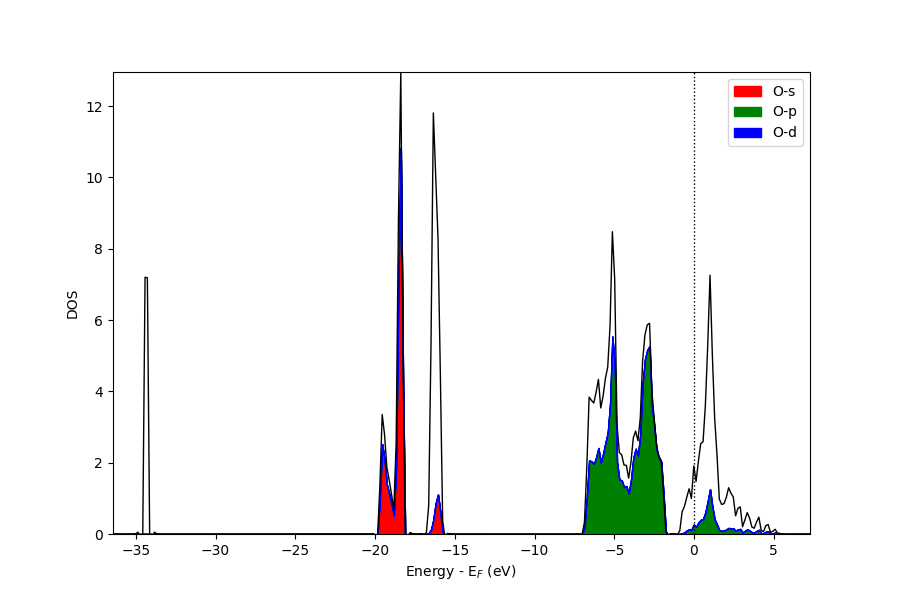
stack_species mode#
orbitals = [4, 5, 6, 7, 8]
spins = [0]

pyprocar.dosplot(
    code="vasp",
    mode="stack_species",
    fermi=5.3017,
    orbitals=orbitals,
    spins=spins,
    dirname=data_dir,
)
            --------------------------------------------------------
            There are additional plot options that are defined in a configuration file.
            You can change these configurations by passing the keyword argument to the function
            To print a list of plot options set print_plot_opts=True

            Here is a list modes : plain , parametric , parameteric_line , stack , stack_orbitals , stack_species , overlay , overlay_orbitals , overlay_species
            --------------------------------------------------------
The plot only considers orbitals [4, 5, 6, 7, 8]

(<Figure size 900x600 with 1 Axes>, <Axes: xlabel='Energy - E$_F$ (eV)', ylabel='DOS'>)
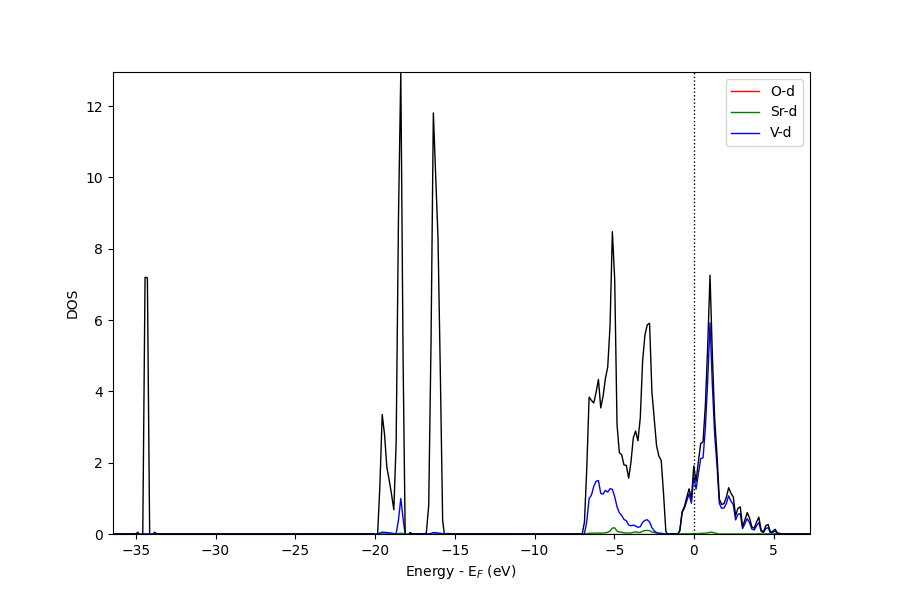
stack_orbtials mode#
atoms = [2, 3, 4]
spins = [0]
pyprocar.dosplot(
    code="vasp",
    mode="stack_orbitals",
    fermi=5.3017,
    atoms=atoms,
    spins=spins,
    dirname=data_dir,
)
            --------------------------------------------------------
            There are additional plot options that are defined in a configuration file.
            You can change these configurations by passing the keyword argument to the function
            To print a list of plot options set print_plot_opts=True

            Here is a list modes : plain , parametric , parameteric_line , stack , stack_orbitals , stack_species , overlay , overlay_orbitals , overlay_species
            --------------------------------------------------------
The plot only considers atoms ['O' 'O' 'O']

(<Figure size 900x600 with 1 Axes>, <Axes: xlabel='Energy - E$_F$ (eV)', ylabel='DOS'>)
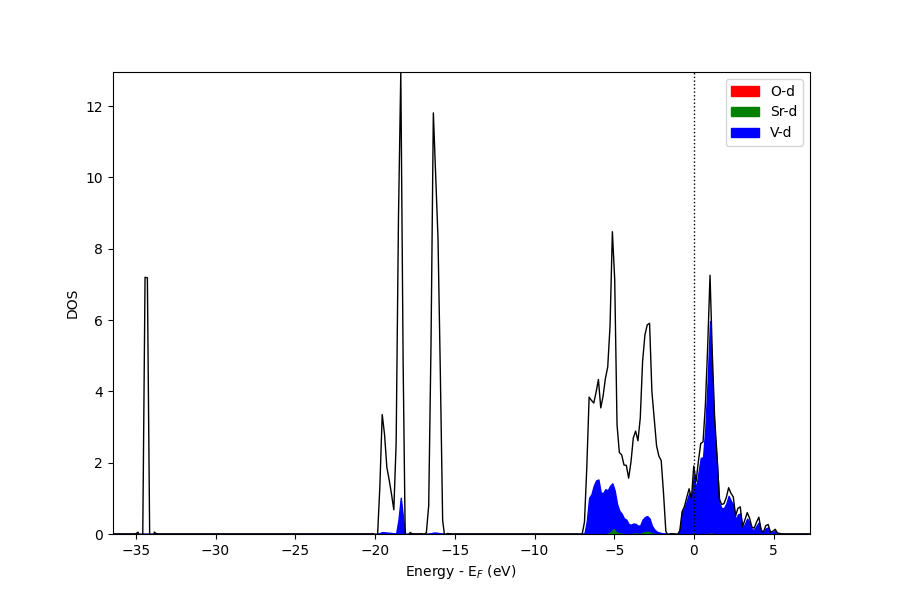
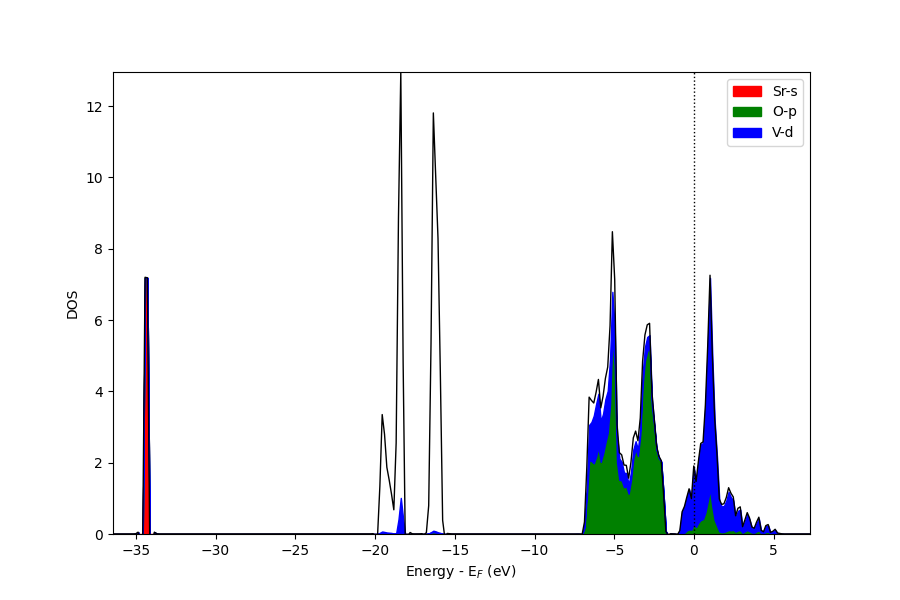
stack mode#
items = dict(Sr=[0], O=[1, 2, 3], V=[4, 5, 6, 7, 8])
pyprocar.dosplot(code="vasp", mode="stack", fermi=5.3017, items=items, dirname=data_dir)
            --------------------------------------------------------
            There are additional plot options that are defined in a configuration file.
            You can change these configurations by passing the keyword argument to the function
            To print a list of plot options set print_plot_opts=True

            Here is a list modes : plain , parametric , parameteric_line , stack , stack_orbitals , stack_species , overlay , overlay_orbitals , overlay_species
            --------------------------------------------------------

(<Figure size 900x600 with 1 Axes>, <Axes: xlabel='Energy - E$_F$ (eV)', ylabel='DOS'>)
overlay_species mode#
orbitals = [4, 5, 6, 7, 8]
spins = [0]

pyprocar.dosplot(
    code="vasp",
    mode="overlay_species",
    fermi=5.3017,
    orbitals=orbitals,
    spins=spins,
    dirname=data_dir,
)
            --------------------------------------------------------
            There are additional plot options that are defined in a configuration file.
            You can change these configurations by passing the keyword argument to the function
            To print a list of plot options set print_plot_opts=True

            Here is a list modes : plain , parametric , parameteric_line , stack , stack_orbitals , stack_species , overlay , overlay_orbitals , overlay_species
            --------------------------------------------------------
The plot only considers orbitals [4, 5, 6, 7, 8]

(<Figure size 900x600 with 1 Axes>, <Axes: xlabel='Energy - E$_F$ (eV)', ylabel='DOS'>)
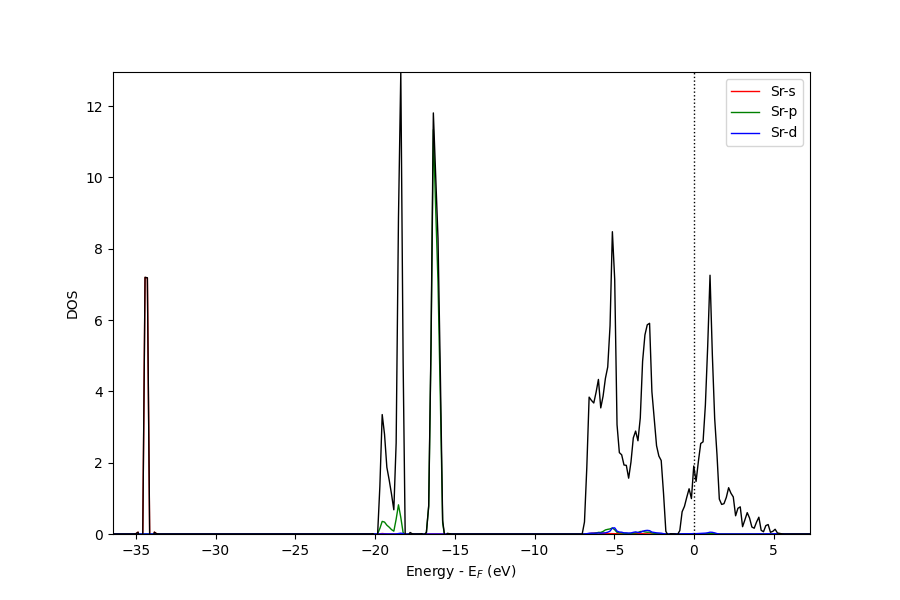
overlay_orbtials mode#
atoms = [0]
spins = [0]
pyprocar.dosplot(
    code="vasp",
    mode="overlay_orbitals",
    fermi=5.3017,
    atoms=atoms,
    spins=spins,
    dirname=data_dir,
)
            --------------------------------------------------------
            There are additional plot options that are defined in a configuration file.
            You can change these configurations by passing the keyword argument to the function
            To print a list of plot options set print_plot_opts=True

            Here is a list modes : plain , parametric , parameteric_line , stack , stack_orbitals , stack_species , overlay , overlay_orbitals , overlay_species
            --------------------------------------------------------
The plot only considers atoms ['Sr']

(<Figure size 900x600 with 1 Axes>, <Axes: xlabel='Energy - E$_F$ (eV)', ylabel='DOS'>)
overlay mode#
items = dict(Sr=[0], O=[1, 2, 3], V=[4, 5, 6, 7, 8])
pyprocar.dosplot(
    code="vasp", mode="overlay", fermi=5.3017, items=items, dirname=data_dir
)
            --------------------------------------------------------
            There are additional plot options that are defined in a configuration file.
            You can change these configurations by passing the keyword argument to the function
            To print a list of plot options set print_plot_opts=True

            Here is a list modes : plain , parametric , parameteric_line , stack , stack_orbitals , stack_species , overlay , overlay_orbitals , overlay_species
            --------------------------------------------------------

(<Figure size 900x600 with 1 Axes>, <Axes: xlabel='Energy - E$_F$ (eV)', ylabel='DOS'>)
Total running time of the script: (0 minutes 4.406 seconds)