Note
Go to the end to download the full example code.
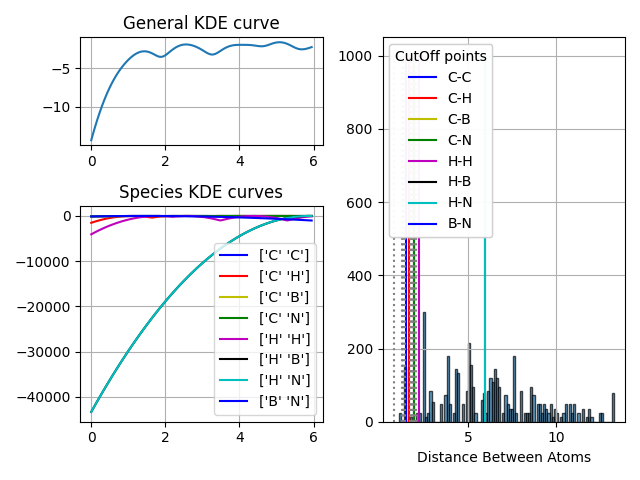
Analyzing Radial Distribution Functions (RDF)#
In this example, we’ll explore the radial distribution functions (RDF) of an atomic structure. The RDF provides insights into the probability of finding an atom at a certain distance from another. This can be useful for understanding the local environment of atoms.
We’ll use the pyprocar package to:
Parse the POSCAR file and obtain atomic positions.
Compute the general KDE curve for all distances.
Compute KDE curves for specific atomic species interactions.
Visualize the results using matplotlib.
Let’s dive in!
import itertools
import os

import matplotlib.pyplot as plt
import numpy as np
from matplotlib.gridspec import GridSpec

import pyprocar.pyposcar as p
from pyprocar.utils import DATA_DIR

colors = ["b", "r", "y", "g", "m", "k", "c"]

data_dir = os.path.join(DATA_DIR, "examples", "PyPoscar", "04-rdf")
Parsing the POSCAR file#
a = p.poscar.Poscar(os.path.join(data_dir, "POSCAR-AGNR-defect.vasp"))
a.parse()
Computing RDF and KDE Curves#
my_rdf = p.rdf.RDF(poscar=a)
thresholdSp = my_rdf.neighbor_thresholdSp

# Calculates KDE curves for each species interaction
spCurves = my_rdf.KDE_CurveSp()
# All calculations share the same kde space
domain = my_rdf.KDE_space
print("CutOff values for each interaction")
for inter, cutoff in zip(my_rdf.interactions, thresholdSp):
    print(inter, " ", cutoff)


print(
    "As you can see most interactions have meaaningfull values,"
    " but there is no way to defene nearest neighbors for others (e.g. H-B)."
    " A large cutoff is provided in these cases."
)

print(
    "Note: The class for finding nearest neighbors uses a database to ignore these large distances as `nearest neighbors`"
)

NeighborsClass = p.latticeUtils.Neighbors(poscar=a)
NeighborsClass.estimateMaxBondDist()
Neighbor_threshold = NeighborsClass.d_Max
CutOff values for each interaction
['C' 'C']   1.9500000000000002
['C' 'H']   1.6500000000000001
['C' 'B']   1.9500000000000002
['C' 'N']   1.9500000000000002
['H' 'H']   2.2
['H' 'B']   5.95
['H' 'N']   5.95
['B' 'N']   1.4772259999999975
As you can see most interactions have meaaningfull values, but there is no way to defene nearest neighbors for others (e.g. H-B). A large cutoff is provided in these cases.
Note: The class for finding nearest neighbors uses a database to ignore these large distances as `nearest neighbors`
Visualizing the Results#
gs = GridSpec(2, 2, height_ratios=[1, 2])

ax1 = plt.subplot(gs[0, 0])
ax2 = plt.subplot(gs[1, 0])
ax3 = plt.subplot(gs[:, 1])

# fig,axes = plt.subplots(2,2)


# This is the kde curve for all the distances in POSCAR
ax1.plot(domain, my_rdf.KDE_Curve())
ax1.set_title("General KDE curve")

cc = itertools.cycle(colors)
for i, curve in enumerate(spCurves):
    label = my_rdf.interactions[i]
    c = next(cc)
    ax2.plot(domain, curve, label=label, color=c)
    ax2.set_title("Species KDE curves")
    ax2.legend()


Neighbor_threshold = np.ndarray.flatten(Neighbor_threshold)
Neighbor_threshold = set(Neighbor_threshold)
print("The DataBase Thresholds are:")
print(Neighbor_threshold)

# Distances for Histogram

distance_matrix = my_rdf.distances
distance_matrix = np.array(distance_matrix)
distances = np.ndarray.flatten(distance_matrix)
bins = 100
n, bins, patches = ax3.hist(distances, bins=bins, edgecolor="black", alpha=0.7)

ax3.set_xlabel("Distance Between Atoms")

# Plotting CutOff point vertical lines

labels = my_rdf.interactions
labels = labels.tolist()

Plotlabels = []
for interaction in labels:
    Plotlabels.append(interaction[0] + "-" + interaction[1])

cc = itertools.cycle(colors)
var_cutoffs = []
for i, cutOff in enumerate(thresholdSp):
    c = next(cc)
    var_cutoffs.append(
        ax3.plot([cutOff, cutOff], [0, 1000], color=c, label=my_rdf.interactions[i])
    )
leg1 = ax3.legend(
    title="CutOff points",
    handles=[x[0] for x in var_cutoffs],
    labels=Plotlabels,
    loc="upper left",
)

cc = itertools.cycle(colors)
data_cutoffs = []


for i, cutOff in enumerate(Neighbor_threshold):
    c = next(cc)
    data_cutoffs.append(
        ax3.plot([cutOff, cutOff], [0, 1000], color="grey", linestyle="dotted")
    )

# leg2 = ax3.legend(title = 'DataBased CutOff', handles = [x[0] for x in data_cutoffs], labels = color_label,loc = 'upper right')

ax3.add_artist(leg1)
# ax3.add_artist(leg2)

ax1.grid(True)
ax2.grid(True)
ax3.grid(True)

plt.tight_layout()
plt.show()
C:\Users\lllang\Desktop\Current_Projects\pyprocar\examples\06-PyPoscar\plot_rdf_cutoff_pyposcar.py:91: MatplotlibDeprecationWarning: Passing label as a length 2 sequence when plotting a single dataset is deprecated in Matplotlib 3.9 and will error in 3.11.  To keep the current behavior, cast the sequence to string before passing.
  ax2.plot(domain, curve, label=label, color=c)
The DataBase Thresholds are:
{0.7725483399593904, 1.8348023074035522, 1.9434419177103412, 1.7744469683442248, 1.3036753236814713, 1.4123149339882604, 1.2433199846221439, 2.0520815280171307, 1.883086578651014, 1.7140916292848973}
C:\Users\lllang\Desktop\Current_Projects\pyprocar\examples\06-PyPoscar\plot_rdf_cutoff_pyposcar.py:125: MatplotlibDeprecationWarning: Passing label as a length 2 sequence when plotting a single dataset is deprecated in Matplotlib 3.9 and will error in 3.11.  To keep the current behavior, cast the sequence to string before passing.
  ax3.plot([cutOff, cutOff], [0, 1000], color=c, label=my_rdf.interactions[i])
Total running time of the script: (0 minutes 0.531 seconds)