Note
Go to the end to download the full example code.
Plotting bandsdosplot#
This example illustrates how to utilize various configurations for plotting both band structures and density of states (DOS) side by side using the pyprocar package. It provides a structured way to explore and demonstrate different configurations for the bandsdosplot function.
Preparation#
Before diving into plotting, we need to download the example files. Use the following code to do this. Once downloaded, specify the bands_dir and dos_dir to point to the location of the downloaded data.
Downloading example#
bands_dir = pyprocar.download_example(save_dir='',
                             material='Fe',
                             code='vasp',
                             spin_calc_type='non-spin-polarized',
                             calc_type='bands')

dos_dir = pyprocar.download_example(save_dir='',
                             material='Fe',
                             code='vasp',
                             spin_calc_type='non-spin-polarized',
                             calc_type='dos')
import os

import pyprocar

bands_dir = os.path.join(
    pyprocar.utils.DATA_DIR, "examples", "Fe", "vasp", "non-spin-polarized", "bands"
)
dos_dir = os.path.join(
    pyprocar.utils.DATA_DIR, "examples", "Fe", "vasp", "non-spin-polarized", "dos"
)
# Section 1: Plain Mode with Default Settings
# ++++++++++++++++++++++++++++++++++++++++++++++++++++++++++++++++++++++++++++++
#
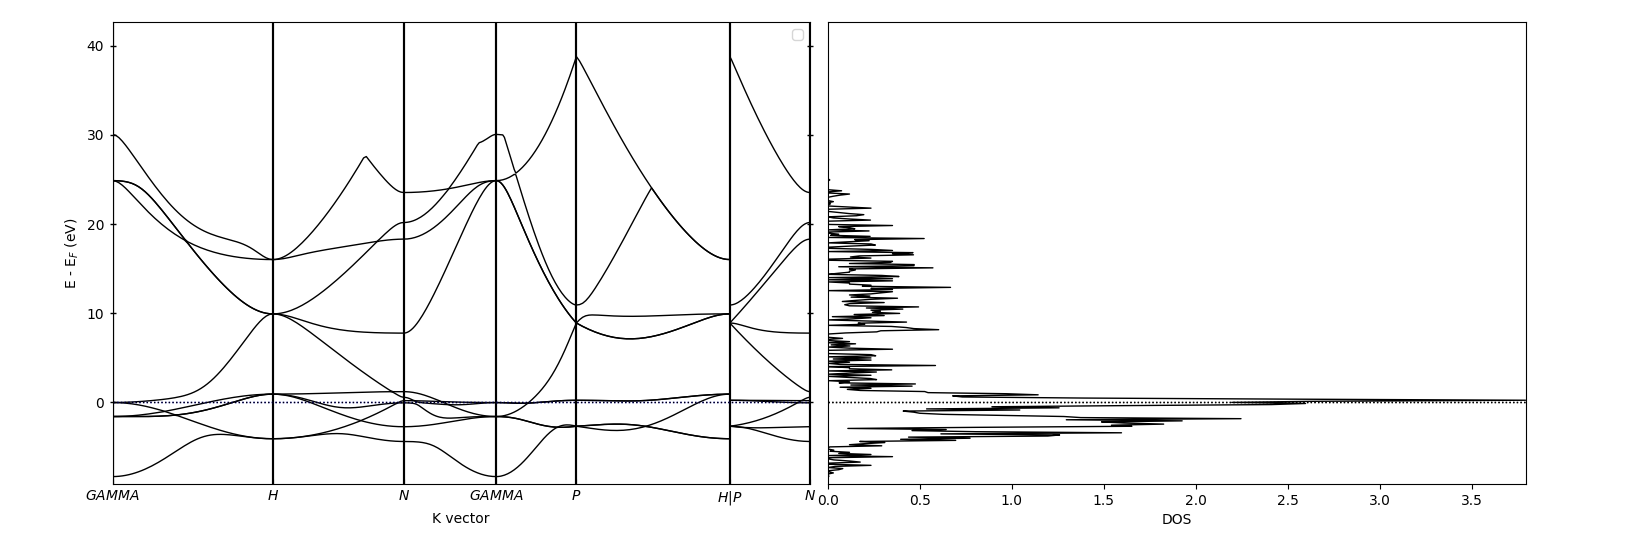
# This section demonstrates how to plot both band structures and DOS side by side using default settings.
# The keywords that work for `bandsplot` and `dosplot` will also work in `bandsdosplot`.
# These keyword arguments can be set in `bands_settings` and `dos_settings` as demonstrated below.
#
bands_settings = {
"mode": "plain",
"fermi": 5.599480, # This will overide the default fermi value found in bands directory
"dirname": bands_dir,
}
dos_settings = {
"mode": "plain",
"fermi": 5.599480, # This will overide the default fermi value found in dos directory
"dirname": dos_dir,
}
pyprocar.bandsdosplot(
code="vasp",
bands_settings=bands_settings,
dos_settings=dos_settings,
)
 ____        ____
|  _ \ _   _|  _ \ _ __ ___   ___ __ _ _ __
| |_) | | | | |_) | '__/ _ \ / __/ _` | '__|
|  __/| |_| |  __/| | | (_) | (_| (_| | |
|_|    \__, |_|   |_|  \___/ \___\__,_|_|
       |___/
A Python library for electronic structure pre/post-processing.

Version 6.3.2 created on Jun 10th, 2021

Please cite:
 Uthpala Herath, Pedram Tavadze, Xu He, Eric Bousquet, Sobhit Singh, Francisco Muñoz and Aldo Romero.,
 PyProcar: A Python library for electronic structure pre/post-processing.,
 Computer Physics Communications 251 (2020):107080.


Developers:
- Francisco Muñoz
- Aldo Romero
- Sobhit Singh
- Uthpala Herath
- Pedram Tavadze
- Eric Bousquet
- Xu He
- Reese Boucher
- Logan Lang
- Freddy Farah


            ----------------------------------------------------------------------------------------------------------
            There are additional plot options that are defined in the configuration file.
            You can change these configurations by passing the keyword argument to the function.
            To print a list of all plot options set `print_plot_opts=True`

            Here is a list modes : plain , parametric , scatter , atomic , overlay , overlay_species , overlay_orbitals
            ----------------------------------------------------------------------------------------------------------


            --------------------------------------------------------
            There are additional plot options that are defined in a configuration file.
            You can change these configurations by passing the keyword argument to the function
            To print a list of plot options set print_plot_opts=True

            Here is a list modes : plain , parametric , parameteric_line , stack , stack_orbitals , stack_species , overlay , overlay_orbitals , overlay_species
            --------------------------------------------------------

(<Figure size 1650x550 with 2 Axes>, <Axes: xlabel='K vector', ylabel='E - E$_F$ (eV)'>, <Axes: xlabel='DOS'>)
# Section 2: Customizing Bands and DOS Plots
# ++++++++++++++++++++++++++++++++++++++++++++++++++++++++++++++++++++++++++++++
#
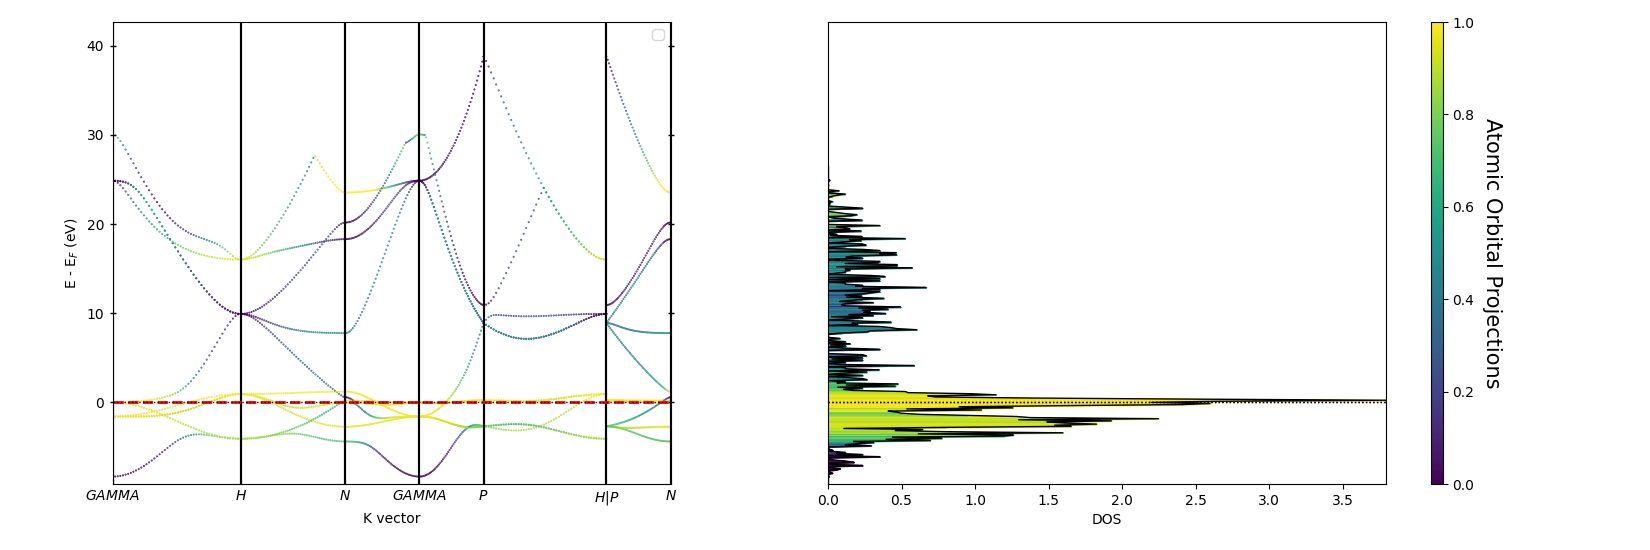
# This section demonstrates how to customize the appearance of both the band structures and DOS plots.
# We'll adjust the colormap, color limits, Fermi line properties, and other settings.
#
bands_settings = {
"mode": "scatter",
"dirname": bands_dir,
"fermi": 5.599480, # This will overide the default fermi value found in bands directory
"atoms": [0],
"orbitals": [4, 5, 6, 7, 8],
"cmap": "viridis",
"clim": [0, 1],
"fermi_color": "red",
"fermi_linestyle": "--",
"fermi_linewidth": 2.0,
}
dos_settings = {
"mode": "parametric",
"dirname": dos_dir,
"fermi": 5.599480, # This will overide the default fermi value found in dos directory
"atoms": [0],
"orbitals": [4, 5, 6, 7, 8],
"cmap": "viridis",
"clim": [0, 1],
"marker": ["v", "o"],
"markersize": [10, 5],
}
pyprocar.bandsdosplot(
code="vasp",
bands_settings=bands_settings,
dos_settings=dos_settings,
)
 ____        ____
|  _ \ _   _|  _ \ _ __ ___   ___ __ _ _ __
| |_) | | | | |_) | '__/ _ \ / __/ _` | '__|
|  __/| |_| |  __/| | | (_) | (_| (_| | |
|_|    \__, |_|   |_|  \___/ \___\__,_|_|
       |___/
A Python library for electronic structure pre/post-processing.

Version 6.3.2 created on Jun 10th, 2021

Please cite:
 Uthpala Herath, Pedram Tavadze, Xu He, Eric Bousquet, Sobhit Singh, Francisco Muñoz and Aldo Romero.,
 PyProcar: A Python library for electronic structure pre/post-processing.,
 Computer Physics Communications 251 (2020):107080.


Developers:
- Francisco Muñoz
- Aldo Romero
- Sobhit Singh
- Uthpala Herath
- Pedram Tavadze
- Eric Bousquet
- Xu He
- Reese Boucher
- Logan Lang
- Freddy Farah


            ----------------------------------------------------------------------------------------------------------
            There are additional plot options that are defined in the configuration file.
            You can change these configurations by passing the keyword argument to the function.
            To print a list of all plot options set `print_plot_opts=True`

            Here is a list modes : plain , parametric , scatter , atomic , overlay , overlay_species , overlay_orbitals
            ----------------------------------------------------------------------------------------------------------


            --------------------------------------------------------
            There are additional plot options that are defined in a configuration file.
            You can change these configurations by passing the keyword argument to the function
            To print a list of plot options set print_plot_opts=True

            Here is a list modes : plain , parametric , parameteric_line , stack , stack_orbitals , stack_species , overlay , overlay_orbitals , overlay_species
            --------------------------------------------------------

(<Figure size 1650x550 with 3 Axes>, <Axes: xlabel='K vector', ylabel='E - E$_F$ (eV)'>, <Axes: xlabel='DOS'>)
# Section 3: Adjusting Figure Size and DPI
# ++++++++++++++++++++++++++++++++++++++++++++++++++++++++++++++++++++++++++++++
#
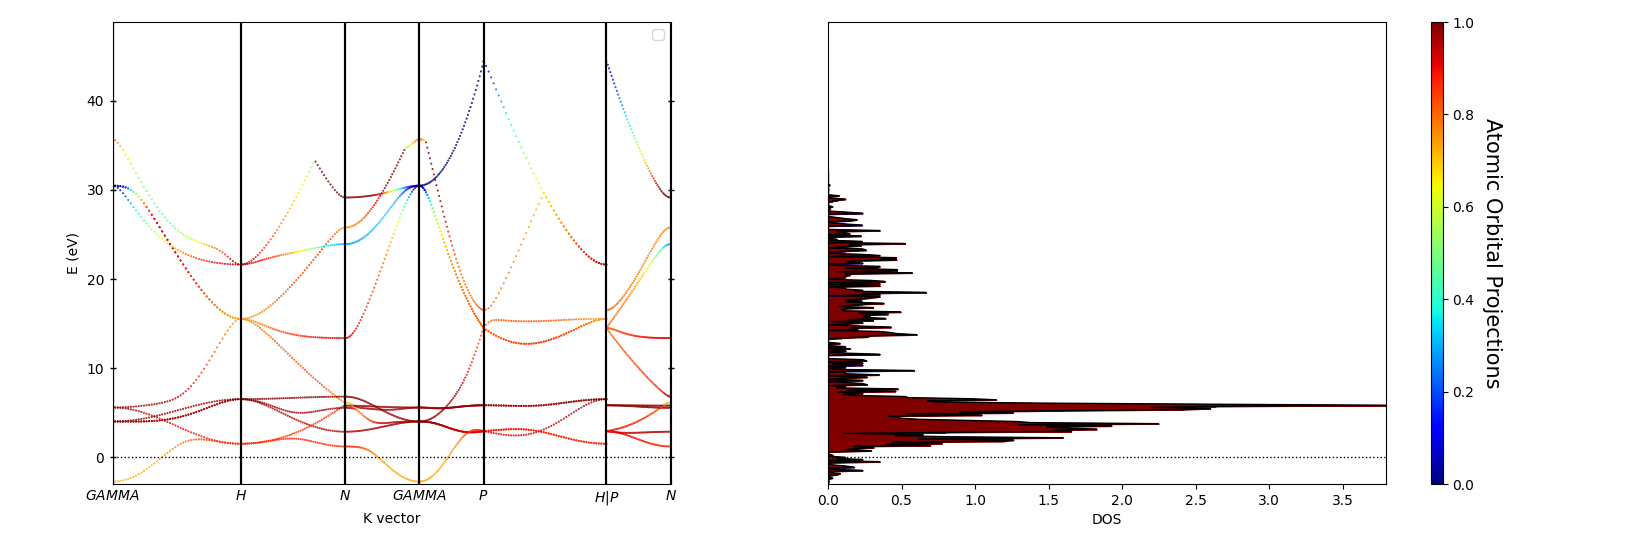
# This section demonstrates how to adjust the overall figure size and dots per inch (DPI) for the combined plot.
#
bands_settings = {"mode": "scatter", "dirname": bands_dir}
dos_settings = {"mode": "parametric", "dirname": dos_dir}
pyprocar.bandsdosplot(
code="vasp",
bands_settings=bands_settings,
dos_settings=dos_settings,
figure_size=(12, 7),
dpi=300,
)
 ____        ____
|  _ \ _   _|  _ \ _ __ ___   ___ __ _ _ __
| |_) | | | | |_) | '__/ _ \ / __/ _` | '__|
|  __/| |_| |  __/| | | (_) | (_| (_| | |
|_|    \__, |_|   |_|  \___/ \___\__,_|_|
       |___/
A Python library for electronic structure pre/post-processing.

Version 6.3.2 created on Jun 10th, 2021

Please cite:
 Uthpala Herath, Pedram Tavadze, Xu He, Eric Bousquet, Sobhit Singh, Francisco Muñoz and Aldo Romero.,
 PyProcar: A Python library for electronic structure pre/post-processing.,
 Computer Physics Communications 251 (2020):107080.


Developers:
- Francisco Muñoz
- Aldo Romero
- Sobhit Singh
- Uthpala Herath
- Pedram Tavadze
- Eric Bousquet
- Xu He
- Reese Boucher
- Logan Lang
- Freddy Farah


            ----------------------------------------------------------------------------------------------------------
            There are additional plot options that are defined in the configuration file.
            You can change these configurations by passing the keyword argument to the function.
            To print a list of all plot options set `print_plot_opts=True`

            Here is a list modes : plain , parametric , scatter , atomic , overlay , overlay_species , overlay_orbitals
            ----------------------------------------------------------------------------------------------------------


            WARNING : `fermi` is not set! Set `fermi={value}`. The plot did not shift the bands by the Fermi energy.
            ----------------------------------------------------------------------------------------------------------


            --------------------------------------------------------
            There are additional plot options that are defined in a configuration file.
            You can change these configurations by passing the keyword argument to the function
            To print a list of plot options set print_plot_opts=True

            Here is a list modes : plain , parametric , parameteric_line , stack , stack_orbitals , stack_species , overlay , overlay_orbitals , overlay_species
            --------------------------------------------------------

            WARNING : `fermi` is not set! Set `fermi={value}`. The plot did not shift the energy by the Fermi energy.
            ----------------------------------------------------------------------------------------------------------


(<Figure size 1650x550 with 3 Axes>, <Axes: xlabel='K vector', ylabel='E (eV)'>, <Axes: xlabel='DOS'>)
Total running time of the script: (0 minutes 2.004 seconds)