Note
Go to the end to download the full example code.
Substituting Atoms in a POSCAR File#
In this example, we’ll demonstrate how to substitute atoms in a POSCAR file using the pyprocar package. Specifically, we will:
Read a POSCAR file containing atomic positions and lattice vectors.
Visualize the initial atomic positions.
Substitute a boron (B) atom with a nitrogen (N) atom.
Visualize the atomic positions after the substitution.
Create GIFs to visualize the atomic structures from different angles.
Before diving in, make sure to have pyvista, numpy, and pyprocar installed.
import os
from itertools import product

import numpy as np
import pyvista as pv

import pyprocar.pyposcar as p
from pyprocar.utils import DATA_DIR

# Define the data directory
data_dir = os.path.join(DATA_DIR, "examples", "PyPoscar", "00-Poscar")
# You do not need this. This is to ensure an image is rendered off screen when generating exmaple gallery.
pv.OFF_SCREEN = True
Reading and Parsing the POSCAR File#
# Read the POSCAR file
a = p.Poscar(os.path.join(data_dir, "POSCAR-YB6.vasp"))
a.parse()

# Display lattice, elements, and positions
print("Lattice:")
print(a.lat)
print("\nElements:")
print(a.elm)
print("\nPositions in Direct coordinates")
print(a.dpos)


# Convert positions to Cartesian coordinates for visualization
atoms_before = pv.PolyData(np.dot(a.dpos, a.lat))
atoms_before["atoms"] = a.elm
labels_before = [elm + f":{point}" for elm, point in zip(a.elm, a.dpos)]
Lattice:
[[4.098 0.    0.   ]
 [0.    4.098 0.   ]
 [0.    0.    4.098]]

Elements:
['B', 'B', 'B', 'B', 'B', 'B', 'Y']

Positions in Direct coordinates
[[ 0.1989  0.5     0.5   ]
 [ 0.8011  0.5     0.5   ]
 [ 0.5     0.1989  0.5   ]
 [ 0.5     0.8011  0.5   ]
 [ 0.5     0.5     0.1989]
 [ 0.5     0.5     0.8011]
 [-0.     -0.      0.    ]]
Atom Substitution#
# Substitute the second B atom with an N atom
print("\n\nChanging the the second atom from B to N\n" + "-" * 40)
new_pos = a.dpos[1]
a.remove(atoms=1)
a.add(position=new_pos, element="N", direct=True)
print("\nElements after substitution:")
print(a.elm)
print("\nPositions in Direct coordinates after substitution:")
print(a.dpos)

# Define the unit cell using lattice vectors
unit_cell_comb = list(product([0, 1], repeat=3))
unit_cell = np.array(
    [
        comb[0] * a.lat[0] + comb[1] * a.lat[1] + comb[2] * a.lat[2]
        for comb in unit_cell_comb
    ]
)
unit_cell = pv.PolyData(unit_cell)

# Convert positions to Cartesian coordinates for visualization
atoms_after = pv.PolyData(np.dot(a.dpos, a.lat))
atoms_after["atoms"] = a.elm
labels_after = [elm + f":{point}" for elm, point in zip(a.elm, a.dpos)]
Changing the the second atom from B to N
----------------------------------------

Elements after substitution:
['B', 'B', 'B', 'B', 'B', 'Y', 'N']

Positions in Direct coordinates after substitution:
[[ 0.1989  0.5     0.5   ]
 [ 0.5     0.1989  0.5   ]
 [ 0.5     0.8011  0.5   ]
 [ 0.5     0.5     0.1989]
 [ 0.5     0.5     0.8011]
 [-0.     -0.      0.    ]
 [ 0.8011  0.5     0.5   ]]
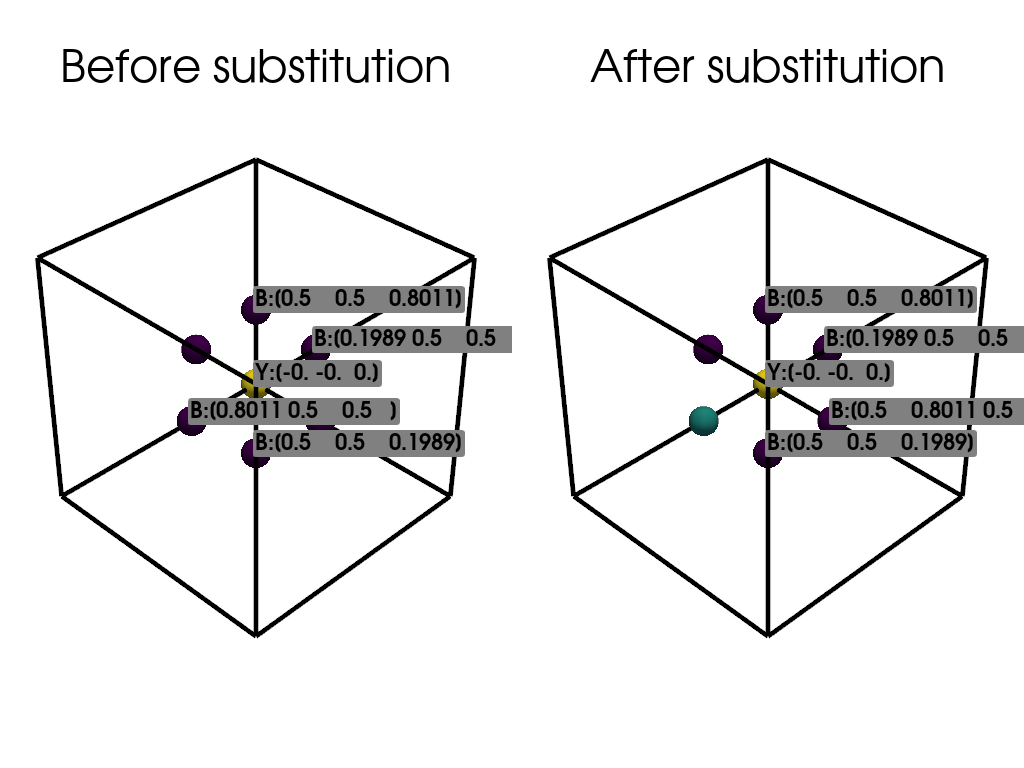
Visualization of Atomic Structures#
# Visualize the atomic structures side by side
plotter = pv.Plotter(shape=(1, 2), border=False)
# Before substitution
plotter.subplot(0, 0)
plotter.add_mesh(
    unit_cell.delaunay_3d().extract_feature_edges(),
    color="black",
    line_width=5,
    render_lines_as_tubes=True,
)
plotter.add_point_labels(
    points=atoms_before.points,
    labels=labels_before,
    show_points=False,
    always_visible=True,
)
plotter.add_mesh(
    atoms_before,
    scalars="atoms",
    point_size=30,
    render_points_as_spheres=True,
    show_scalar_bar=False,
)
plotter.add_title("Before substitution")
# After substitution
plotter.subplot(0, 1)
plotter.add_mesh(
    unit_cell.delaunay_3d().extract_feature_edges(),
    color="black",
    line_width=5,
    render_lines_as_tubes=True,
)
plotter.add_point_labels(
    points=atoms_after.points,
    labels=labels_after,
    show_points=False,
    always_visible=True,
)
plotter.add_mesh(
    atoms_after,
    scalars="atoms",
    point_size=30,
    render_points_as_spheres=True,
    show_scalar_bar=False,
)
plotter.add_title("After substitution")
plotter.show()
Creating GIFs for Visualization#
# Define a function to create a GIF visualization of the atomic structure
def create_gif(atoms, labels, unit_cell, save_file):
    plotter = pv.Plotter()
    title = save_file.split(os.sep)[-1].split(".")[0]
    plotter.add_title(title)
    plotter.add_mesh(
        unit_cell.delaunay_3d().extract_feature_edges(),
        color="black",
        line_width=5,
        render_lines_as_tubes=True,
    )
    plotter.add_point_labels(
        points=atoms.points, labels=labels, show_points=False, always_visible=True
    )
    plotter.add_mesh(
        atoms,
        scalars="atoms",
        point_size=30,
        render_points_as_spheres=True,
        show_scalar_bar=False,
    )
    path = plotter.generate_orbital_path(n_points=36)
    plotter.open_gif(os.path.join(data_dir, save_file))
    plotter.orbit_on_path(path, write_frames=True, viewup=[0, 0, 1], step=0.05)
    plotter.close()


# Create GIFs for atomic structures before and after substitution
create_gif(
    atoms=atoms_before,
    labels=labels_before,
    unit_cell=unit_cell,
    save_file="atoms_before.gif",
)
create_gif(
    atoms=atoms_after,
    labels=labels_after,
    unit_cell=unit_cell,
    save_file="atoms_after.gif",
)

Total running time of the script: (0 minutes 8.542 seconds)