Note
Go to the end to download the full example code.
Unfolding Band Structure#
Unfolding Band Structure example.
First download the example files with the code below. Then replace data_dir below.
Downloading example#
 supercell_dir = pyprocar.download_example(save_dir='',
                             material='MgB2',
                             code='vasp',
                             spin_calc_type='non-spin-polarized',
                             calc_type='supercell_bands')

 primitive_dir = pyprocar.download_example(save_dir='',
                             material='MgB2',
                             code='vasp',
                             spin_calc_type='non-spin-polarized',
                             calc_type='primitive_bands')
importing pyprocar and specifying local data_dir
import os

import numpy as np

import pyprocar

supercell_dir = os.path.join(
    pyprocar.utils.DATA_DIR,
    "examples",
    "MgB2_unfold",
    "vasp",
    "non-spin-polarized",
    "supercell_bands",
)
primitive_dir = os.path.join(
    pyprocar.utils.DATA_DIR,
    "examples",
    "MgB2_unfold",
    "vasp",
    "non-spin-polarized",
    "primitive_bands",
)
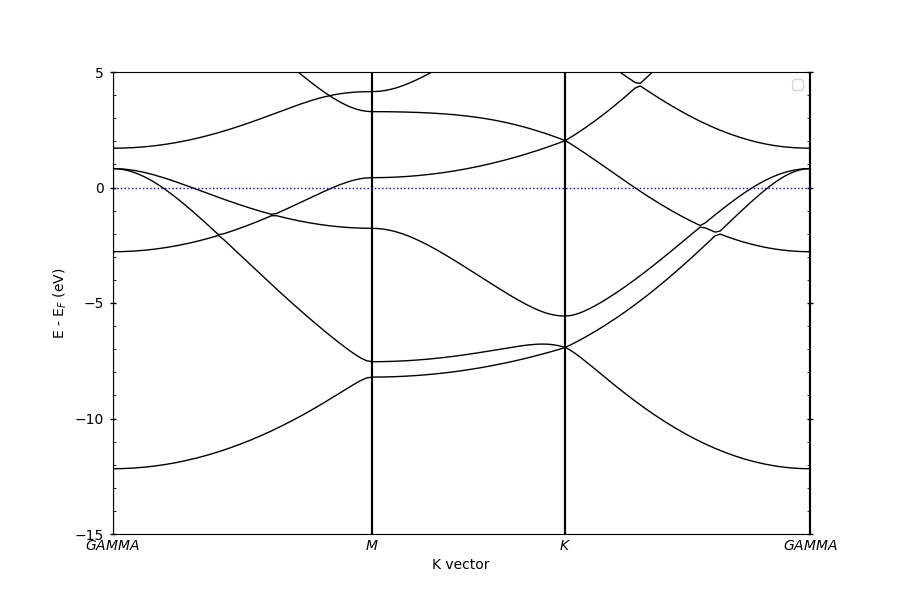
Plotting primitive bands#
pyprocar.bandsplot(
    code="vasp", mode="plain", fermi=4.993523, elimit=[-15, 5], dirname=primitive_dir
)
            ----------------------------------------------------------------------------------------------------------
            There are additional plot options that are defined in the configuration file.
            You can change these configurations by passing the keyword argument to the function.
            To print a list of all plot options set `print_plot_opts=True`

            Here is a list modes : plain , parametric , scatter , atomic , overlay , overlay_species , overlay_orbitals
            ----------------------------------------------------------------------------------------------------------


(<Figure size 900x600 with 1 Axes>, <Axes: xlabel='K vector', ylabel='E - E$_F$ (eV)'>)
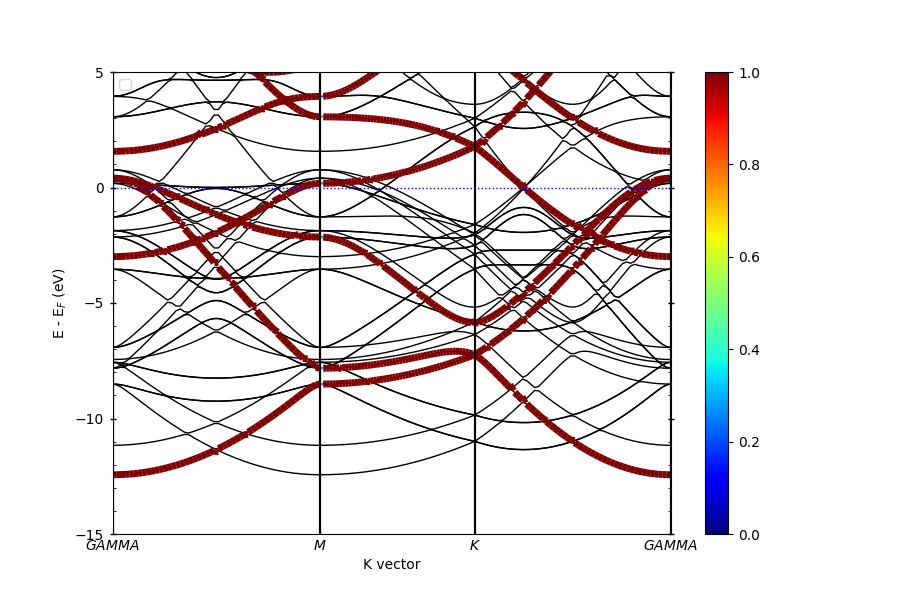
Unfolding of the supercell bands#
Here we do unfolding of the supercell bands. In this calculation, the POSCAR and KPOINTS will be different from the primitive cell For the POSCAR, we create a 2 2 2 supercell from the primitive. For the KPOINTS, the paths need to be changed to reflect the change in the unitcell
pyprocar.unfold(
    code="vasp",
    mode="plain",
    unfold_mode="both",
    fermi=5.033090,
    dirname=supercell_dir,
    elimit=[-15, 5],
    supercell_matrix=np.diag([2, 2, 2]),
)
 ____        ____
|  _ \ _   _|  _ \ _ __ ___   ___ __ _ _ __
| |_) | | | | |_) | '__/ _ \ / __/ _` | '__|
|  __/| |_| |  __/| | | (_) | (_| (_| | |
|_|    \__, |_|   |_|  \___/ \___\__,_|_|
       |___/
A Python library for electronic structure pre/post-processing.

Version 6.3.2 created on Jun 10th, 2021

Please cite:
 Uthpala Herath, Pedram Tavadze, Xu He, Eric Bousquet, Sobhit Singh, Francisco Muñoz and Aldo Romero.,
 PyProcar: A Python library for electronic structure pre/post-processing.,
 Computer Physics Communications 251 (2020):107080.


Developers:
- Francisco Muñoz
- Aldo Romero
- Sobhit Singh
- Uthpala Herath
- Pedram Tavadze
- Eric Bousquet
- Xu He
- Reese Boucher
- Logan Lang
- Freddy Farah


            --------------------------------------------------------
            There are additional plot options that are defined in a configuration file.
            You can change these configurations by passing the keyword argument to the function
            To print a list of plot options set print_plot_opts=True

            Here is a list modes : plain , parametric , scatter , atomic , overlay , overlay_species , overlay_orbitals
            --------------------------------------------------------


(<Figure size 900x600 with 2 Axes>, <Axes: xlabel='K vector', ylabel='E - E$_F$ (eV)'>)
Total running time of the script: (0 minutes 20.196 seconds)